%20(2)-1.png?v=2)
Here is the latest in the real estate market in the San Diego’s East County region in the following zip codes: 91901, 91905, 91906, 91916, 91917, 91931, 91934, 91935, 91941, 91942, 91945, 91948, 91962, 91963, 91977, 91978, 91980, 92004, 92019, 92020, 92021, 92036, 92040, 92066, 92070, 92086. The following statistics on housing market activity in the East County is from the HomeDex Housing Market Report for August 2018.
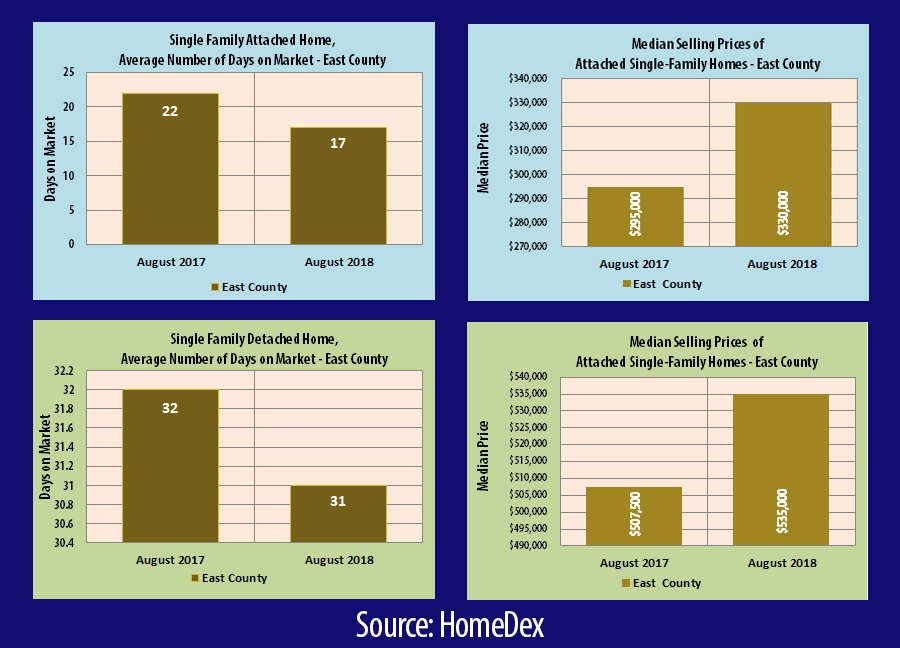
- The median sales price for a detached single-family home in East County reached $535,000 in August 2018, which was 5.4 percent higher than the $507,500 price in August 2017. The August 2018 monthly figure for detached homes is higher than the year-to-date median sales price of $522,000.
- For attached homes, the median home price in the East County was $330,000 in August 2018, which was 11.9 percent higher compared to the $295,000 price the same month a year ago. The August 2018 monthly figure for attached homes is higher than the year-to-date median sales price of $320,000.
- The average number of days in August for an East County home on the market (the time between when a property is listed and an offer is accepted) was 31 days for detached homes and 17 days for attached homes. In August 2017, the numbers were 32 and 22 days, respectively.
- Closed sales totaled 304 detached units in August 2018, which was a 24.9 percent year-over-year drop compared to the 405 units sold in August 2017. For attached home sales, closed sales totaled 103 in August, a 12 percent decline from August 2017’s total of 117.
- The percentage of original list price received for detached homes was 98.4 percent in August, a 0.3 percent change from 98.7 percent in August 2017. For attached homes, the percentage was 99.3 percent in August, a 0.4 percent difference from 99.7 percent in August 2017.
- The number of new detached listings on the market in August totaled 672, a 21.7 percent increase from the 552 new listings in August 2017. For new attached listings, the total was 143 in August, a 9.2 percent increase from the 131 new listings in August 2017.
- The year-to-date totals for detached listings was 6,285 through August, a 7.4 percent increase from 5,854 listings through August 2017; the year-to-date total for attached property listings was 1,663 through August, a 17.2 percent increase from the 1,491 listings through August 2017.
According to HomeDex, the economy is under scrutiny, but certainly not deteriorating. While some housing experts are starting to look for recessionary signs such as fewer sales, dropping prices and even foreclosures, others are taking a more cautious and research-based approach to their predictions. Housing starts are performing admirably, prices are still inching upward, supply remains low and consumers are optimistic. A report from the National Association of Home Builders (NAHB) said that rising home prices, higher interest rates and increased building material costs have pressured housing affordability to a 10-year low. Nationally, median household income has risen 2.6 percent in the last 12 months, while home prices are up 6 percent.