As a follow-up from white-hot conditions in both home sales and prices, the California housing market moderated for the third straight month in July.
Both home sales and prices have tempered from the heated market conditions seen over the past year, according to the monthly home sales and price report from the California Association of REALTORS® (C.A.R.).
Closed escrow sales of existing, single-family detached homes statewide on a seasonally adjusted annualized rate were dipped 1.6 percent in July 2021, when 428,980 homes were sold, compared to the previous month of June 2021 when 436,020 homes were sold. July 2021 statewide home sales also were down 2 percent from July 2020, when 437,890 homes were sold on an annualized basis. The statewide annualized sales figure, collected from more than 90 local REALTOR® associations and MLSs statewide, represents what would be the total number of homes sold during 2021 if sales maintained the July pace throughout the year. It is adjusted to account for seasonal factors that typically influence home sales.
Despite the slight decline, July’s statewide sale total was the second highest for a July in the past six years. Also, the state’s home sales pace maintained a solid year-to-date increase of 27.3 percent.
In San Diego, home sales in July 2021 were 7.4 percent lower compared to June 2021, but 1.4 percent higher than July 2020.
Home prices also remained at moderate levels in July 2021.
After setting record highs for the past four consecutive months, California’s median home price slipped 1 percent on a month-to-month basis to $811,170 in July 2021, down from June 2021’s $819,630 and up 21.7 percent from the $666,320 recorded last July 2020. The median price in California remained above the $800,000 benchmark for the fourth consecutive month.
In San Diego, the median price for a single-family detached home in July 2021 was $860,000, which was $5,000 or 0.6 percent lower than the June 2021 price of $865,000, but 19.6 percent higher compared to the July 2020 price of $719,000.
July 2021 County Sales and Price Activity
(Regional and condo sales data not seasonally adjusted)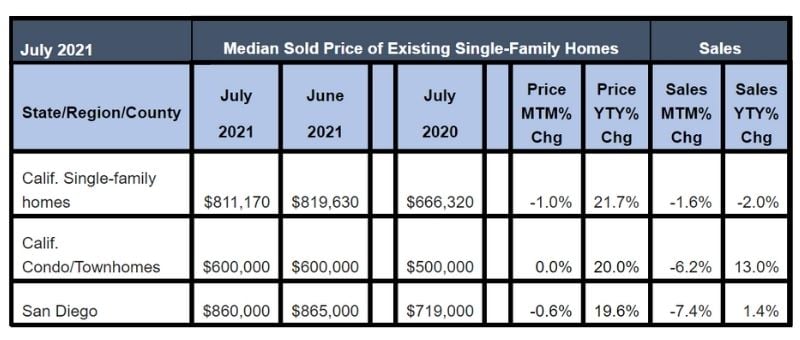
“The California housing market continues to normalize from the white-hot conditions we experienced at the height of the pandemic with both sales and prices moderating as we slowly transition from the peak home-buying season into the fall,” said C.A.R. President Dave Walsh. “The market remains solid, however, as sales were still the second highest level for a July in the last six years, and the statewide median price continues to perform above last year’s level by double-digits. Housing supply, while improved, remains tight and market competition is still heated with homes flying off the market in record time.”
“Despite dipping slightly from its record peak set in June, California’s median price remains elevated as supply constraints continue to provide upward pressure to support home prices,” said Jordan Levine, C.A.R. Vice President and Chief Economist. “However, home prices should ease as housing inventory improves in the third quarter and the market continues to normalize during the traditional off-season.”
Other key points from C.A.R.’s July 2021 resale housing report included:
-- At the regional level, all major regions posted a dip in sales from a year ago, when home sales began to surge as mortgage rates continued their downward trend. San Francisco Bay Area (-1.4 percent) and Southern California (-1.4 percent) held up relatively well, but more affordable counties within the regions such as Napa (-36.9 percent), Solano (-14.7 percent) and San Bernardino (-13.2 percent) also recorded sharp declines from a year ago.
-- Active listings in California in July 2021 reached the highest level since last October 2020, signaling continuous improvement in the state’s housing supply condition. The number of for-sale properties increased 15.4 percent in July 2021 from June 2021 as more homes were being listed on the market. Despite an increase in total active listings in July, new listings added in the month dipped slightly for the first time after gaining year-over-year for four straight months. New active listings inched up by 0.7 percent from June 2021 to July 2021 percent but dipped on a year-over-year basis from July 2020 by 0.9 percent. Housing supply typically climbs during this time of the year and remains on an upward trend until late July-to-early August.
-- The imbalance between supply and demand continued to heat up the market, with many buyers offering sales bids over the asking price. In July, more than 70 percent of homes sold above their asking price, making it the tenth consecutive month since September 2020 that more than half of homes sold above their asking price.
-- Statewide, the unsold inventory of available homes for sale improved slightly from 1.7 months in June 2021 to 1.9 months in July 2021, but remained sharply below last year’s level of 2.1 months for July 2020. Inventory levels measured in months indicate the number it would take for the available supply of homes on the market to sell-out given the current rate of sales.
July 2021 County Unsold Inventory and Days on Market
(Regional and condo sales data not seasonally adjusted)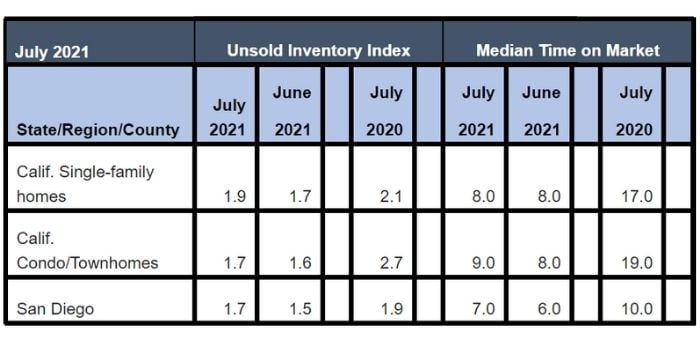
-- In San Diego County, the inventory of available homes for sales in July 2021 also improved slightly to 1.7 months, compared to 1.5 months in June 2021, but below last year’s level of 1.9 months in July 2020.
-- The median number of days it took to sell a California single-family home was eight days in July 2021, which was the same number for June 2021, down from 17 days in July 2020. The eight-day figure compares to seven days in May 2021 and April 2021. Prior to setting record low numbers this year, the previous statewide record was nine days in November 2020.
-- In San Diego County, the median number of days an existing, single-family home remained unsold on the market was seven days in July 2021. That number compares to six days in June 2021, seven days in May 2021, six days in April 2021 and March 2021 and seven days in February 2021 and January 2021, as well as eight days in December 2020 and seven days in November, October and September 2020. The timeframe a year ago in July 2020 was 10 days. The median represents a timeframe when half the homes sell above it and half below it.
-- The statewide sales-price-to-list-price radio was 103.8 percent in July 2021 and 100 percent in July 2020. Sales-to-list-price ratio is an indicator that reflects the negotiation power of home buyers and home sellers under current market conditions. The ratio is calculated by dividing the final sales price of a property by its last list price and is expressed as a percentage. A sales-to-list ratio with 100 percent or above suggests that the property sold for more than the list price, and a ratio below 100 percent indicates that the price sold below the asking price.
-- The 30-year, fixed-mortgage interest rate averaged 2.87 percent in July, down from 2.98 percent in July 2020, according to Freddie Mac. The five-year, adjustable mortgage interest rate was an average of 2.49 percent, compared to 3.02 percent in July 2020.