ELEVATED INTEREST RATES, INVENTORY SHORTAGE DICTATING THE MARKET

Posted by Rick Griffin on Jul 8, 2023 6:30:00 AM

ELEVATED INTEREST RATES, INVENTORY SHORTAGE DICTATING THE MARKET

Elevated interest rates and a shortage of homes for sale continued to dictate the California housing market in June 2023, with the year-over-year price decline at its lowest rate this year, according to the latest home sales and price report from the California Association of REALTORS® (C.A.R.).

For June 2023, in San Diego, home sales were lower and home prices were higher in month-over-month comparisons between June 2023 and May 2023.

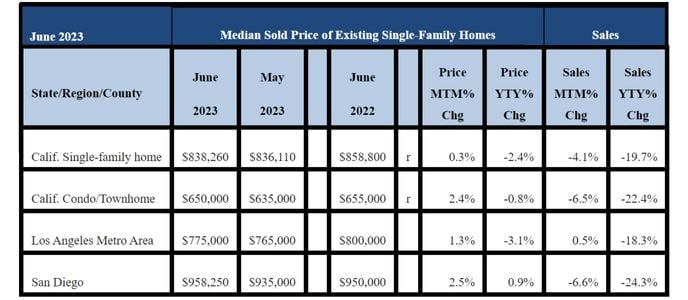
Sales of existing, single-family homes in San Diego County in June 2023 declined by 6.6 percent in a month-over-month comparison with May 2023, while the figure was 24.3 percent lower in a year-over-year comparison with June 2022.

Meanwhile, the median sales price for an existing, single-family detached home in San Diego County increased in June 2023 to $958,250, compared to $935,000 in May 2023, a 2.5 percent difference. In a year-over-year comparison, the median price was $950,000 in June 2022, a 0.9 percent difference.

June 2023 County Sales and Price Activity
(Regional and condo sales data not seasonally adjusted)
June 2023 County Sales and Price Activity

Statewide, the sales pace for existing, single-family homes in June 2023 was down by 4.1 percent, compared to May 2023, when 289,460 homes were sold, and it was down by 19.7 percent from June 2022, when a revised 345,760 homes were sold on an annualized basis.

Closed escrow sales of existing, single-family detached homes in California totaled a seasonally adjusted annualized rate of 277,490 in June, according to information collected by C.A.R. from more than 90 local REALTOR® associations and MLSs statewide. The statewide annualized sales figure represents what would be the total number of homes sold during 2023 if sales maintained the June pace throughout the year. It is adjusted to account for seasonal factors that typically influence home sales.

Sales of existing single-family homes in California remained below the 300,000-unit pace for the ninth consecutive month. The yearly drop was the smallest since May 2022 and marked the first time in a year that sales dropped by less than 20 percent from a year ago.

However, the smaller decline was due primarily to weaker sales last June, when sales dropped below 350,000 for the first time in two years.

Year-to-date statewide home sales were down 32.9 percent in June 2023.

California’s median home price exceeded $800,000 in June for the third straight month, edging up 0.3 percent from $836,110 in May 2023 to $838,260 in June 2023. The statewide median price continued to rise and reached the highest level in 10 months. The tight housing supply and more high-end homes being sold relative to prior months continued to put upward pressure on prices.

Despite the improvement from early 2023, the median home price in California in June 2023 dipped 2.4 percent on a year-over-year basis for the eighth consecutive month from $858,800 in June 2022.

While the downward movement in home prices appears to indicate that housing values are stabilizing, more dips in the median price are expected in the coming months as rates will likely remain elevated for most, if not the entire third quarter of 2023. Higher home prices are a warning signal that housing affordability could remain low in the second half of the year.

“California’s housing market has improved since the winter and appears to have found its footing as sales declined at the slowest pace in over a year,” said C.A.R. President Jennifer Branchini, a Bay Area REALTOR®. “Despite elevated interest rates, the demand for housing continues to outpace the availability of homes for sale, as buyers slowly adapt to the new normal under the current housing market conditions.”

“Buyer demand appears to have stabilized after rates doubled last year, though rates could still move higher in the coming months,” said C.A.R. Senior Vice President and Chief Economist Jordan Levine. “As inflation finally subsides later this year, the market could see some improvement as rates and supply conditions start turning around.”

Other key points from C.A.R.’s June 2023 resale housing report include:

  • At the regional level, year-over-year sales declined in June 2023 in the Southern California region by 19.4 percent.

  • At the regional level, median home prices in June 2023 dropped from a year ago in the Southern California region by 1.8 percent.

  • Housing inventory in California inched up in June 2023, compared to May 2023, but it was lower than in June 2022, as tight housing supply continues to be the norm. With mortgage rates expected to be high in the next couple of months, California may not see any meaningful improvement in its housing inventory throughout the third quarter.

  • The statewide unsold inventory in June 2023 increased 4.8 percent, compared to May 2023, but dropped 8.3 percent from a year ago in June 2022.

  • Active listings statewide for June 2023 fell sharply by 34 percent, compared to June 2022. It was the largest year-over-year decline since May 2021.

  • Unsold inventory in June 2023 declined in several price ranges from a year ago in June 2022. The mid-price segment of $750,000-$999,000 recorded the biggest year-over-year decline in unsold inventory of 16 percent, followed by the $500,000-$749,000 price range (-12.5 percent) and the sub-$500,000 (-11.5 percent). Unsold inventory in June 2023 for homes priced at $1 million and higher was unchanged in month-over-month and year-over-year comparisons.

June 2023 County Unsold Inventory and Days on Market
(Regional and condo sales data not seasonally adjusted)
June 2023 County Unsold Inventory and Days on Market

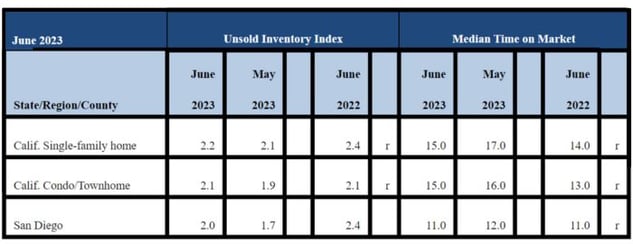
  • Statewide unsold inventory on a monthly basis increased to 2.2 months, compared to 2.1 months for May 2023 and 2.4 months for May 2022.

  • In San Diego, in June 2023, the inventory of available homes for sale was 2.0 months, compared to 1.7 months for May 2023 and 2.4 months for May 2022. Other unsold inventory figures in 2023 in San Diego included 1.7 months in May, 1.9 months in April, 1.7 months in March, 2.3 months in February and 2.7 months in January. Inventory levels indicate the number of months it would take for the available supply of homes on the market to sell-out given the current rate of sales.

  • Statewide, the median number of days it took to sell a California single-family home was 15 days in June 2023, compared to 17 days in May 2023, 20 days in April 2023 and 14 days a year ago in June 2022.

  • In San Diego, the median number of days it took to sell an existing, single-family home was 11 days in June 2023, compared to 12 days in May 2023 and 11 days in June 2022. Other median-time-on-the-market figures in San Diego in 2023 include 12 days in May and April, 15 days in March, 17 days in February and 26 days in January. The median represents a time when half the homes sell above it and half below it.

  • The statewide, sales-price-to-list-price ratio was at 100 percent in June, May and April 2023, 99.1 percent in March 2023, 97.7 percent in February 2023 and 96.5 percent in January 2023. A year ago, in June 2022, the ratio was 101.3 percent. The sales-to-list-price ratio is an indicator that reflects the negotiation power of home buyers and home sellers under current market conditions. The ratio is calculated by dividing the final sales price of a property by its last list price and is expressed as a percentage. A sales-to-list ratio with 100 percent or above suggests that the property sold for more than the list price, and a ratio below 100 percent indicates that the price sold below the asking price.

  • The 30-year, fixed-mortgage interest rate averaged 6.71 percent in June, up from 5.52 percent in June 2022, according to Freddie Mac.

Topics: Brokers/Managers, Market Information

Lower Mortgage Rates Helped Market Rebound in May

Posted by Rick Griffin on Jun 22, 2023 10:15:00 AM

RISING INTEREST RATES DEPRESS HOME SALES, PRICES

A reprieve in mortgage interest rates helped the California housing market rebound in May 2023 with homes sales at an eight-month high, according to the latest home sales and price report from the California Association of REALTORS® (C.A.R.).

In San Diego during May 2023, both home sales and home prices were higher in month-over-month comparisons with April 2023.

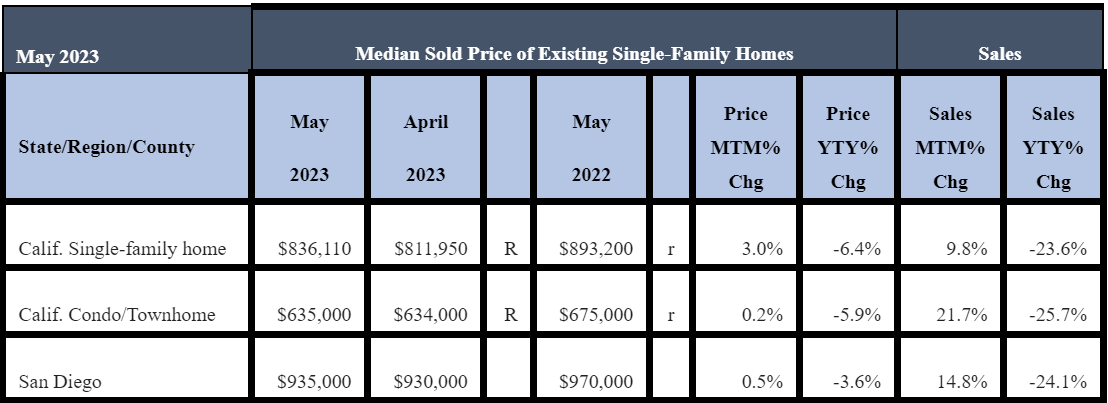
Sales of existing, single-family homes in San Diego County increased in May 2023 by 14.8 percent in a month-over-month comparison with April 2023, but the figure was 24.1 percent lower in a year-over-year comparison with May 2022.

Meanwhile, the median sales price for an existing, single-family detached home in San Diego County increased in May 2023 to $935,000, compared to $930,000 in April 2023, a 0.5 percent difference. In a year-over-year comparison, the median price was $970,000 in May 2022, a 3.6 percent difference.

May 2023 County Sales and Price Activity
(Regional and condo sales data not seasonally adjusted)

May 2023 County Sales and Price Activity

Statewide, the sales pace for existing, single-family homes was up 9.8 percent in May 2023, compared to April 2023, and it as down 23.6 percent from May 2022.

Closed escrow sales of existing, single-family detached homes in California totaled a seasonally adjusted annualized rate of 289,460 in May, according to information collected by C.A.R. from more than 90 local REALTOR® associations and MLSs statewide. The statewide annualized sales figure represents what would be the total number of homes sold during 2023 if sales maintained the May pace throughout the year. It is adjusted to account for seasonal factors that typically influence home sales.

May’s sales pace of 289,460 homes sold was up 9.8 percent on a monthly basis from 263,650 home sold in April 2023 and down 23.6 percent from a year ago in May 2022, when a revised 378,640 homes were sold on an annualized basis.

Sales of existing single-family homes in California remained below the 300,000-unit pace for the eighth consecutive month.

Year-to-date statewide homes sales were down 35.1 percent in May 2023.

Also statewide, the median home price in May 2023 increased by 3.0 percent to $836,110, compared to $811,950 in April 2023. It was the second straight month for the statewide median home price to exceed $800,000. In a year-over-year comparison, the statewide median home price was down 6.4 percent from $893,200 in May 2022.

The statewide median price continued to rise and reached the highest level in nine months. Tight housing supply and more high-end homes being sold relative to prior months continued to put upward pressure on prices. 

“The bounceback in May’s home sales and price shows the resilience of California’s housing market and is a testament to the value that consumers place on homeownership,” said C.A.R. President Jennifer Branchini, a Bay Area REALTOR®. “The housing market is stabilizing and even showing signs of improvement as competition is on the rise again; nearly half of homes are selling above asking price, fewer sellers are reducing listing prices, and homes for sale are going into pending status in just two weeks compared to more than 30 days early this year.”

“While home sales rose solidly in May, we don’t expect to see a rapid recovery because of the lock-in effect that’s keeping prospective sellers with low interest rate mortgages from listing their homes on the market and keeping inventory extremely tight.” said C.A.R. Senior Vice President and Chief Economist Jordan Levine. “Consequently, we expect prices to continue to rise on a month-to-month basis for the next few months because of the shortage of homes for sale. Even with reduced homebuyer demand, California still has more homebuyers than homes to put them in. It is this imbalance between supply and demand that continues to put upward pressure on home prices and nudge the median price up month over month since the beginning of the year.”

Other key points from C.A.R.’s May 2023 resale housing report include:

-- At the regional level, all major regions recorded year-over-year sales declines in May 2023. Southern California declined 22.3 percent from May 2022.

-- At the regional level, median home prices dropped from a year ago in all major regions. Southern California home prices declined by 5.3 percent in May 2023.

-- Despite mortgage rates rising sharply since mid-May and peaking at their highest point in six months, the number of pending sales recorded in May remained steady and only dipped slightly by less than 2 percent from the prior month. The consistent level of open-escrow sales suggests that the California housing market will register closed sales in June at around 275,000, a similar level between what was recorded in April and May.

-- Housing inventory in California dipped in May after a brief bounce-back in April, as sales improved while supply remained tight. The statewide unsold inventory index in May 2023 was flat from last year and declined 16 percent on a month-over-month basis. Assuming a softer sales level in June 2023, the market could see a minor inventory improvement in the upcoming month, but the upward adjustment would be due to a change in demand.

May 2023 County Unsold Inventory and Days on Market
(Regional and condo sales data not seasonally adjusted)

May 2023 County Unsold Inventory and Days on Market

-- Housing inventory increased in all price ranges in May 2023, compared with May 2022. In year-over-year comparisons, the unsold inventory index recorded a gain of 21.1 percent in the $1 million-and-higher price sector and remained flat in the $500,000-$749,000 price range (zero percent). Lower inventory levels dipped year-over-year in the $750,000-$999,000 sector (-9.1 percent) and the sub-$500,000 sector (-4.3 percent).

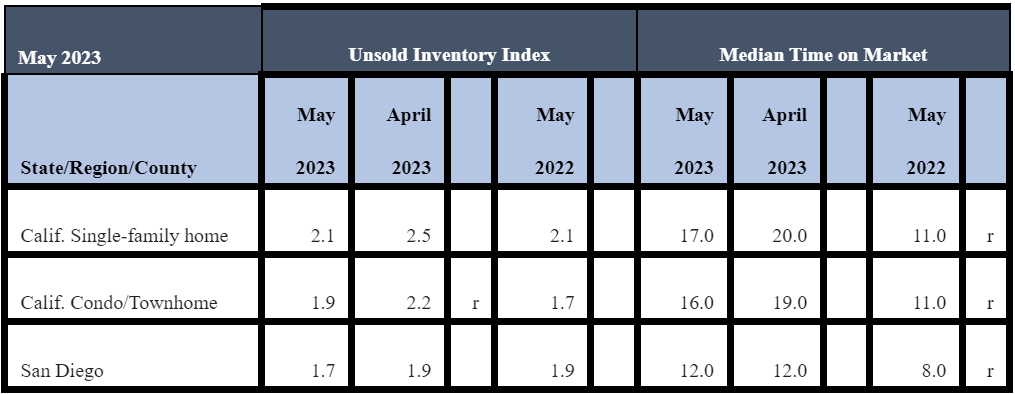
-- The statewide unsold inventory index on a monthly basis declined to 2.1 months for May 2023, compared to 2.5 months for April 2023 and 2.1 months for May 2022.

-- In San Diego, in May 2023, the inventory of available homes for sale was 1.7 months, compared to 1.9 months in April 2023, 1.7 months in March 2023, 2.3 months in February 2023, 2.7 months in January 2023 and 1.9 months in May 2022. Inventory levels indicate the number of months it would take for the available supply of homes on the market to sell-out given the current rate of sales.

-- Statewide, the median number of days it took to sell a California single-family home was 17 days in May 2023, 20 days in April 2023 and 11 days in May 2022.

-- In San Diego, the median number of days it took to sell an existing, single-family home was 12 days in May 2023, compared to 12 days in April 2023, 15 days in March 2023 and eight days in May 2022.  Other median-time-on-the-market figures in San Diego in 2023 include 17 days in February and 26 days in January. The median represents a time when half the homes sell above it and half below it.

-- The statewide, sales-price-to-list-price ratio was at 100 percent in May 2023, 100 percent in April 2023, 99.1 percent in March 2023, 97.7 percent in February 2023 and 96.5 percent in January 2023. A year ago, in May 2022, the ratio was 103.4 percent. The sales-to-list-price ratio is an indicator that reflects the negotiation power of home buyers and home sellers under current market conditions. The ratio is calculated by dividing the final sales price of a property by its last list price and is expressed as a percentage. A sales-to-list ratio with 100 percent or above suggests that the property sold for more than the list price, and a ratio below 100 percent indicates that the price sold below the asking price.

-- The 30-year, fixed-mortgage interest rate averaged 6.43 percent in May, up from 5.23 percent in May 2022, according to Freddie Mac.

Topics: Brokers/Managers, Market Information

San Diego Median Home Price Hits $930K in April

Posted by Rick Griffin on May 25, 2023 1:46:01 PM

RISING INTEREST RATES DEPRESS HOME SALES, PRICES

A surge in mortgage interest rates and a shortage of homes for sale is suppressing the California housing market, according to the April 2023 home sales and price report from the California Association of REALTORS® (C.A.R.).

For April 2023 in San Diego, home sales were lower and home prices were higher in month-over-month comparisons between April 2023 and March 2023.

Sales of existing, single-family homes in San Diego County decreased in April 2023 by 8.2 percent in a month-over-month comparison with March 2023, and 36.9 percent in a year-over-year comparison with April 2022.

April 2023 County Sales and Price Activity
(Regional and condo sales data not seasonally adjusted)

April 2023 County Sales and Price Activity

Meanwhile, the median sales price for an existing, single-family detached home in San Diego County increased in April 2023 to $930,000, compared to $915,000 in March 2023, a 1.6 percent difference. In a year-over-year comparison, the median price was $975,000 in April 2022, a 4.6 percent difference.

Statewide, the sales pace for existing, single-family homes was down 4.7 percent in April 2023, compared to March 2023, and down 36.1 percent from April 2022.

Closed escrow sales of existing, single-family detached homes in California totaled a seasonally adjusted annualized rate of 267,880 in April 2023, according to information collected by C.A.R. from more than 90 local REALTOR® associations and MLSs statewide. The statewide annualized sales figure represents what would be the total number of homes sold during 2023 if sales maintained the April pace throughout the year. It is adjusted to account for seasonal factors that typically influence home sales.

April’s sales pace of 267,880 homes sold in April 2023 was down from 281,050 homes sold in March 2023 and down from a year ago in April 2022, when a revised 418,970 homes were sold on an annualized basis.

Sales of existing single-family homes in California remained below the 300,000-unit level for the seventh consecutive month.

Year-to-date statewide home sales were down 37.4 percent in April 2023.

Also statewide, the median home price in April 2023 increased by 3.0 percent to $815, 340, compared to $791,490 in March 2023.

It was the first time in six months, since October 2022, that California’s median home price surprised the $800,000 level.

Despite the price improvement since early this year, April’s median price was lower on a year-over-year basis for the sixth consecutive month, declining 7.8 percent from the revised $884,680 recorded a year ago in April 2022. 

The sizable drop in median price from last year was due partly to the strong price surge in early 2022 when homebuyers rushed into the market to take advantage of low rates before the Federal Reserve began aggressively raising rates.

“While home sales declined in April, the market is getting more competitive as we’re seeing time on the market before selling down to 20 days in April from 33 days in January and the share of homes sold above asking price double from one in five at the beginning of the year to more than two in five in April,” said C.A.R. President Jennifer Branchini, a Bay Area REALTOR®. “This increase in market competition continued to provide support to the statewide median home price in April, which climbed above $800,000 for the first time in six months.”

“Home sales remained soft as the lock-in effect continued to tighten housing supply and keep would-be sellers from listing their homes for sale, which contributed to a 30 percent year-over-year drop in new statewide active listings, the largest drop since May 2020 when the pandemic shutdown took place,” said C.A.R. Senior Vice President and Chief Economist Jordan Levine. “A surge in borrowing costs as mortgage rates surpassed 7% in late February and early March also contributed to the market weakness, as many transactions that opened in those two months were closed in April.”

Looking ahead, C.A.R. has revised its 2023 Housing Market Forecast and projects existing single-family home sales to reach 279,900 units in 2023, a decline of 18.2 percent from the 342,000 units sold in 2022. While home prices in general are expected to improve in the second half of the year, the California median home price is projected to decrease 5.6 percent to $776,600 in 2023, down from the annual median price of $822,300 recorded in 2022. C.A.R. also expects the 30-year fixed mortgage interest rate will average 6.3 percent for the year.

Other key points from C.A.R.’s April 2023 resale housing report include:

-- At the regional level, all major regions recorded year-over-year sales declines in April 2023. Southern California declined 37.4 percent from April 2022.

-- At the regional level, median home prices dropped from a year ago in all major regions. Southern California home prices declined by 6.2 percent in April 2023.

-- Housing inventory in California bounced back after dipping month-over-month for two straight months. The statewide unsold inventory index in April 2023 also increased from last year, jumping 38.9 percent on a year-over-year basis. The surge in the inventory continued primarily due to low housing demand as existing home sales remained below the 300,000 benchmark.

-- Housing inventory increased by at least 20 percent in all price ranges in April 2023, compared to April 2022. Homes priced at $1 million and higher gained the most in unsold inventory with a 64.7 percent increase, followed by the $500,000-$749,000 price range (33.3 percent), the $750,000-$999,000 price range (21.1 percent), and the sub-$500,000 price range (26.3 percent).

April 2023 County Unsold Inventory and Days on Market
(Regional and condo sales data not seasonally adjusted)

April 2023 County Unsold Inventory and Days on Market

-- The statewide unsold inventory index on a monthly basis increased to 2.5 months in April 2023, compared to 2.2 months in March 2023 and 1.8 months in April 2022.

-- In San Diego, in April 2023, the inventory of available homes for sale was 1.9 months, compared to 1.7 months in March 2023, 2.3 months in February 2023, 2.7 months in January 2023, and 1.6 months in April 2022. Inventory levels indicate the number of months it would take for the available supply of homes on the market to sell out given the current rate of sales.

-- The median number of days it took to sell a California single-family home was 20 days in April 2023, 24 days in March 2023, and 11 days in April 2022.

-- In San Diego, the median number of days it took to sell an existing, single-family home was 12 days in April 2023, compared to 15 days in March 2023 and eight days in April 2022. Other median-time-on-the-market figures in San Diego in 2023 include 17 days in February and 26 days in January. The median represents a time when half the homes sell above it and half below it.

The statewide, sales-price-to-list-price ratio was at 100 percent in April 2023, compared to 99.1 percent in March 2023, 97.7 percent in February 2023 and 96.5 percent in January 2023. A year ago, in April 2022, the ratio was 104.2 percent. The sales-to-list-price ratio is an indicator that reflects the negotiation power of home buyers and home sellers under current market conditions. The ratio is calculated by dividing the final sales price of a property by its last list price and is expressed as a percentage. A sales-to-list ratio with 100 percent or above suggests that the property sold for more than the list price, and a ratio below 100 percent indicates that the price sold below the asking price.

-- The 30-year, fixed-mortgage interest rate averaged 6.34 percent in April, up from 4.98 percent in April 2022, according to Freddie Mac.


Topics: Brokers/Managers, Market Information

Home Sales Strong Despite Uptick in Interest Rates

Posted by Rick Griffin on Apr 24, 2023 9:23:29 AM

RISING INTEREST RATES DEPRESS HOME SALES, PRICES

For the first time in seven months, median home prices in California in March 2023 recorded a healthy increase on a month-to-month basis while higher interest rates held home sales essentially flat, according to the latest home sales and price report from the California Association of REALTORS® (C.A.R.).

In San Diego, both home sales and home prices were higher in month-over-month comparisons between March 2023 and February 2023.

Existing, single-family home sales in San Diego County increased in March 2023 by 34.9 percent in a month-over-month comparison with February 2023. However, in a year-over-year comparison between March 2023 and March 2022, home sales in San Diego County decreased by 32.1 percent.

March 2023 County Sales and Price Activity
(Regional and condo sales data not seasonally adjusted)

March 2023 County Sales and Price Activity

Meanwhile, the median sales price for an existing, single-family detached home in San Diego County increased in March 2023 to $915,000, compared to $875,000 in February 2023, a 4.6 percent difference. In a year-over-year comparison, the median price was $950,000 in March 2022, a 3.7 percent difference.

Statewide, the March 2023 sales pace for existing, single-family homes was down 1.0 percent on a monthly basis from February 2023, and down 34.2 percent from March 2022.

Closed escrow sales of existing, single-family detached homes in California totaled a seasonally adjusted annualized rate of 281,050 in March 2023, according to information collected by C.A.R. from more than 90 local REALTOR® associations and MLSs statewide. The statewide annualized sales figure represents what would be the total number of homes sold during 2023 if sales maintained the March pace throughout the year. It is adjusted to account for seasonal factors that typically influence home sales.

March’s sales pace of 281,050 homes sold was down slightly from 284,010 homes sold in February 2023 and down 34.2 percent from a year ago in March 2022, when a revised 427,040 homes were sold on an annualized basis. Sales of existing single-family homes in California remained below the 300,000-unit pace for the sixth consecutive month.

Year-to-date statewide home sales were down 37.8 percent in March 2023.

Also statewide, the median home price in March 2023 increased by 7.6 percent to $791,490, compared to $735,480 in February 2023. The March 2023 median price was 7 percent lower than the $851,130 price posted in March 2022. The statewide median home price in Mach was lower on a year-over-year basis for the fifth consecutive month. The median is the price at which half of the homes sell for more and half for less.

With home prices rising more sharply than the normal seasonal pattern last year, the market could see larger year-over-year price drops as it moves through the spring home-buying season.

“Despite a dip in March home sales, the competitiveness in the housing market continues to heat up, as homes are selling faster, and the sales-to-list-price ratio is improving, all the while when the number of homes available for sale continues to tighten,” said C.A.R. President Jennifer Branchini, a Bay Area REALTOR®. “All signs point to a market with solid demand, which should help bolster sales through the homebuying season.”

“While home sales continue to hover below the 300,000-unit annualized pace, the market seems to have weathered more aggressive rate hikes and banking failures quite well in the last few weeks,” said C.A.R. Vice President and Chief Economist Jordan Levine. “If interest rates stabilize or even improve in the next couple of months, home sales should rise during the spring home-buying season, but tight inventory will prevent a rapid rebound.”

Other key points from C.A.R.’s March 2023 resale housing report include:

-- At the regional level, all major regions recorded year-over-year sales declines. Southern California declined 33.8 percent from March 2022. Extreme weather conditions had a negative impact on the housing market, which contributed to sharp sales declines in some counties.

-- At the regional level, median home prices dropped from a year ago in all major regions. Southern California home prices declined by 4 percent in March 2023.

March 2023 County Unsold Inventory and Days on Market
(Regional and condo sales data not seasonally adjusted)

March 2023 County Unsold Inventory and Days on Market

-- Housing inventory in California slipped on a monthly basis for the second straight month from 3.2 months in February 2023 to 2.2 months in March 2023, the lowest level since May 2022. The unsold inventory in March 2022 was 1.6 months.

-- In San Diego, in March 2023, the inventory of available homes for sale was 1.7 months, compared to 2.3 months in February 2023, 2.7 months in January 2023, and 1.4 months in March 2022. Other inventory figures in San Diego during 2022 include 2.2 months in December 2022, 2.9 months in November 2022, 3.0 months in October, 2.7 months in September, 2.5 months in August, 3.1 months in July, 2.4 months in June, 1.9 months in May, 1.6 months in April and 1.4 months in March. Inventory levels indicate the number of months it would take for the available supply of homes on the market to sell-out given the current rate of sales.

-- Home prices were higher in March 2023 in all price ranges compared to a year ago in March 2022. In March 2023, homes priced at $1 million or higher gained the most in unsold inventory (50 percent), followed by the $749,000-$500,000 price range (25 percent), $750,000-$999,000 price range (23.5 percent) and sub-$500,000 price range (16.7 percent).

-- Active listings in March 2023 continued to surge. Despite the increase in overall active listings, housing inventory is much tighter than what the yearly growth suggests. While new active listings added in March 2023 improved by 27.9 percent on a month-to-month basis from February 2023, the figure also declined 30 percent in a year-over-year comparison with March 2022. The drop in new active listings, was the largest dip since May 2020 when the pandemic shutdown took place.

-- The median number of days it took to sell a California single-family home was 19 days in March 2023, 17 days in February 2023 and eight days in March 2022.

-- In San Diego, the median number of days it took to sell an existing, single-family home was 12 days in March 2023, compared to 17 days in February 2023, 26 days in January 2023 and seven days in March 2022. Other median-time-on-the-market figures in San Diego during 2022 was 20 days in December, 18 days in both November and October, 19 days in September, 15 days in August, 10 days in July, eight days in June and seven days in May and April. The median represents a time when half the homes sell above it and half below it.in san 

-- Once again, the statewide, sales-price-to-list-price ratio remained at below 100 percent in March 2023 at 99.1 percent, compared to 97.7 percent in February 2023 and 96.5 percent in January 2023. A year ago, in March 2023, the ratio was 103.9 percent. Other statewide ratio percentage figures during 2022 include 96.2 percent in December, 96.7 percent in November, 97.3 percent in October, 97.7 percent in September and 98.4 percent in August. The sales-to-list-price ratio is an indicator that reflects the negotiation power of home buyers and home sellers under current market conditions. The ratio is calculated by dividing the final sales price of a property by its last list price and is expressed as a percentage. A sales-to-list ratio with 100 percent or above suggests that the property sold for more than the list price, and a ratio below 100 percent indicates that the price sold below the asking price.

-- The 30-year, fixed-mortgage interest rate averaged 6.54 percent in March, up from 4.17 percent in March 2022, according to Freddie Mac.


Topics: Brokers/Managers, Market Information

HOME SALES, PRICES WERE HIGHER IN FEBRUARY 2023

Posted by Rick Griffin on Mar 20, 2023 6:48:00 AM

RISING INTEREST RATES DEPRESS HOME SALES, PRICES

The lowest mortgage interest rates in five months helped boost California home sales for the third straight month in February 2023, even as home sales prices continue to slide lower, according to the latest home sales and price report from the California Association of REALTORS® (C.A.R.).

In San Diego, both home sales and home prices were higher in month-over-month comparisons between February and January 2023.

On a statewide basis, closed escrow sales of existing, single-family detached homes totaled a seasonally adjusted annualized rate of 284,010 in February 2023, according to information collected by C.A.R. from more than 90 local REALTOR® associations and MLSs statewide. The statewide annualized sales figure represents what would be the total number of homes sold during 2023 if sales maintained the February pace throughout the year. It is adjusted to account for seasonal factors that typically influence home sales.

The statewide sales pace in February 2023 was up 17.6 percent on a monthly basis from 241,520 in January 2023 but down 33.2 percent from a year ago in February 2022, when a revised 425,120 homes were sold on an annualized basis. 

Despite the third straight month of improvement, sales of existing single-family homes in February 2023 in California remained below the 300,000-unit pace for the fifth consecutive month.

Year-to-date statewide home sales were down 39.6 percent in February 2023.

California’s median home price retreated for the sixth straight month, declining 2.1 percent from the January 2023 median price of $751,330 to $735,480 in February 2023, the lowest price level in two years.

The February 2023 price also was lower on a year-over-year basis for the fourth consecutive month, declining 4.8 percent from the revised $772,180 recorded a year ago in February 2022. 

The statewide median price for a typical home has declined 18.3 percent from May 2022, when it reached its recent peak of $900,170. 

With home prices to remain soft throughout the rest of 2023, home shoppers can expect to see larger price drops moving through the spring home-buying season.

In San Diego, home sales increased month-over-month by 11.5 percent in February 2023, compared to January 2023. In a year-over-year comparison, between February 2023 and February 2022, home sales decreased by 32.6 percent.

February 2023 County Sales and Price Activity
(Regional and condo sales data not seasonally adjusted)

February 2023 County Sales and Price Activity

The San Diego median sales price for an existing, single-family detached home increased in February 2023 to $875,000, compared to $824,950, a 6.1 percent difference. In a year-over-year comparison, the median price was $888,000 in February 2022, a difference of 1.5 percent. The median is the price at which half of the homes sell for more and half for less. 

“A brief interest rate reprieve and softer home prices during January created a window of opportunity for homebuyers to dip their toes into the home-buying waters, which helped boost home sales to the highest level in five months,” said C.A.R. President Jennifer Branchini, a Bay Area REALTOR®. “A shift toward more home sales in the lower-price segments is expected to continue to further soften home prices. However, with the availability of homes remaining extremely tight and housing supply conditions not expected to improve any time soon, prices should find bottom later this year as interest rates stabilize.”

“The recent failure of a handful of tech-focused banks caused an unexpected drop in interest rates, which could offer an opportunity in the near term for homebuyers who have been waiting on the sidelines to lock in a lower rate,” said C.A.R. Vice President and Chief Economist Jordan Levine. “However, any decline in rates is not likely to be sustainable since inflation remains high, and the Federal Reserve is willing to take some calculated risks in order to keep inflation under control.”

Other key points from C.A.R.’s February 2023 resale housing report include:

-- At the regional level, all major regions recorded year-over-year sales declines. Southern California declined 33.8 percent.

-- At the regional level, median home prices dropped from a year ago in all major regions. Prices in Southern California declined by 2 percent.

-- Housing inventory in California slipped to its lowest level in four months. The statewide unsold inventory was 3.2 months in February 2023 and 2.0 months in February 2022, a difference of 60 percent. The unsold inventory in January 2023 was 3.6 months. 

-- In San Diego, in February, the inventory of available homes for sale was 2.3 months, compared to 2.7 months in January 2023 and 1.5 months in February 2022. Other inventory figures in San Diego in 2022 include 2.2 months in December 2022, 2.9 months in November 2022, 3.0 months in October, 2.7 months in September, 2.5 months in August, 3.1 months in July, 2.4 months in June, 1.9 months in May, 1.6 months in April and 1.4 months in March. Inventory levels indicate the number of months it would take for the available supply of homes on the market to sell out given the current rate of sales.

February 2023 County Unsold Inventory and Days on Market
(Regional and condo sales data not seasonally adjusted)

February 2023 County Unsold Inventory and Days on Market

-- Unsold inventory in various home price ranges increased in February 2023 from a year ago by at least 30 percent or higher in the state. The sub-$500,000 range gained the most in unsold inventory (45.9 percent), followed by the $500,000-$750,000 range (42.3 percent), the $1 million and up (33.4 percent) and $750,000-$999,000 category (30.0 percent).

-- Weak housing demand continued to create carryover and elevate inventory on the surface, as 46 of the 51 counties tracked by C.A.R. registered an increase in active listings in February 2023 compared to February 2022.

 -- The median number of days it took to sell a California single-family home was 28 days in February, compared to 33 days in January 2023 and 9 days in February 2022. Other statewide inventory figures for 2022 include 28 days in December, 24 days in November, 23 days in October, 22 days in September, and 19 days in August.

In San Diego, the median number of days it took to sell an existing, single-family home was 17 days in February 2023, compared to 26 days in January 2023 and 7 days in February 2022. Other inventory figures for 2022 in San Diego were 20 days in December, 18 days in both November and October, 19 days in September, 15 days in August, 10 days in July, eight days in June, and seven days in May and April. The median represents a time when half the homes sell above it and half below it.

-- Once again, the statewide, sales-price-to-list-price ratio remained at below 100 percent in February 2023 at 97.7 percent, compared to 96.5 percent in January 2023. A year ago, in February 2022, the ratio was 102.6 percent. Other 2022 statewide ratio percentage figures include 96.2 percent in December, 96.7 percent in November, 97.3 percent in October, 97.7 percent in September and 98.4 percent in August. The sales-to-list-price ratio is an indicator that reflects the negotiation power of home buyers and home sellers under current market conditions. The ratio is calculated by dividing the final sales price of a property by its last list price and is expressed as a percentage. A sales-to-list ratio with 100 percent or above suggests that the property sold for more than the list price, and a ratio below 100 percent indicates that the price sold below the asking price.

-- The 30-year, fixed-mortgage interest rate averaged 6.26 percent in February 2023, up from 3.76 percent in February 2022, according to Freddie Mac.


Topics: Brokers/Managers, Market Information

CALIFORNIA HOME SALES INCH UP, PRICES MODERATE FURTHER

Posted by Rick Griffin on Feb 24, 2023 8:14:15 AM

RISING INTEREST RATES DEPRESS HOME SALES, PRICES

California home sales edged up in January 2023 for the second straight month, while home prices continued to slide and interest rates took a breather, according to the latest home sales and price report from the California Association of REALTORS® (C.A.R.).

In San Diego, home sales and home prices were lower in January 2023 in monthly and yearly comparisons, said C.A.R.

Closed escrow sales of existing, single-family detached homes in California totaled a seasonally adjusted annualized rate of 241,520 units in January 2023, according to information collected by C.A.R. from more than 90 local REALTOR® associations and MLSs statewide. The statewide annualized sales figure represents what would be the total number of homes sold during 2023 if sales maintained the January 2023 pace throughout the entire 2023 year. It is adjusted to account for seasonal factors that typically influence home sales.

The January 2023 sales pace was up 0.4 percent on a monthly basis from a revised 240,630 homes sold in December 2022, and down 45.7 percent compared to a year ago in January 2022, when a revised 444,400 homes were sold on an annualized basis.

January 2023 was the third straight month for home sales at below the 250,000-unit per month sales level.

California’s median home price receded in January 2023 to $751,330, down 3.0 percent from the $774,850 recorded in December 2022, which was the fifth straight monthly decline. The January 2023 home price figure also was lower on a year-over-year basis for the third consecutive month, declining 1.9 percent from the $766,250 recorded a year ago in January 2022.

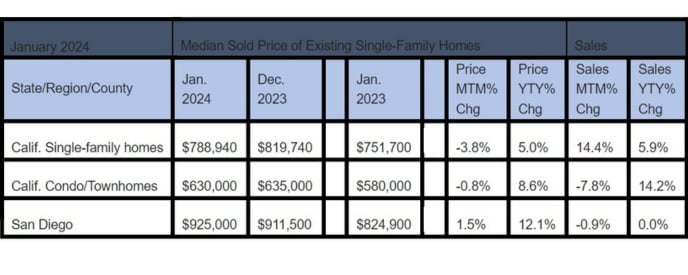
In San Diego, home sales decreased month-over-month by 17.9 percent in January 2023, compared to December 2022. In a year-over-year comparison, between January 2023 and January 2022, home sales decreased by 35.1 percent.

January 2023 County Sales and Price Activity
(Regional and condo sales data not seasonally adjusted)
January 2023 County Sales and Price Activity

The San Diego median sales price for an existing, single-family detached home declined in January 2023 to $824,950, compared to $850,000 in December 2022, a 2.9 percent difference. In a year-over-year comparison, between January 2023 and January 2022, when the price was $875,000, the difference was a 5.7 percent decrease.

“Thanks to slightly waning interest rates and tempering home prices, California’s housing market kicked off the new year with another step up and continued to improve in January as buyers gained more confidence in purchasing a home and the affordability outlook improving slightly,” said C.A.R. President Jennifer Branchini, a Bay Area REALTOR®. “While the monthly sales gains have been nominal over the past two months, the market is moving in the right direction, and more gradual improvements could be coming in the months ahead as the market moves into the spring home-buying season in a few weeks.” 

“Job layoffs in recent months, primarily in the tech sector, have contributed to a decline in both sales and prices in higher-priced housing markets, particularly in the San Francisco Bay Area,” said C.A.R. Vice President and Chief Economist Jordan Levine. “With home prices expected to remain soft and the mix of sales continuing to shift toward less expensive housing units throughout the rest of 2023, the market will see more downward price adjustments in the next few months.” 

 Other key points from C.A.R.’s January 2023 resale housing report include:

-- At the regional level, all major regions recorded year-over-year sales declines of more than one-third in January 2023. Southern California dropped 41.1 percent.

-- At the regional level, median home prices dropped from a year ago in all major regions in January 2023. Prices in Southern California declined by 0.2 percent.

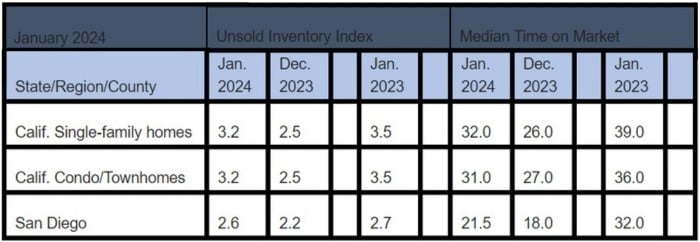
-- Housing inventory in California in January 2023 reached its highest level in 32 months. The January 2023 figure of 3.6 months was double the 1.8 months recorded in January 2022, the same month a year ago. The unsold inventory in December 2022 was at 2.7 months. The statewide January 2023 figure was at a level last seen in May 2020, during the government-mandated pandemic lockdown.

-- In San Diego, the inventory of available homes for sale in January 2023 increased to 2.7 months, compared to 2.2 months in December 2022 and 1.5 months a year ago in January 2022. Other inventory figures in San Diego in 2022 include 2.2 months in December 2022, 2.9 months in November 2022, 3.0 months in October, 2.7 months in September, 2.5 months in August, 3.1 months in July, 2.4 months in June, 1.9 months in May, 1.6 months in April and 1.4 months in March. Inventory levels indicate the number of months it would take for the available supply of homes on the market to sell-out given the current rate of sales.

January 2023 County Unsold Inventory and Days on Market
(Regional and condo sales data not seasonally adjusted)
January 2023 County Unsold Inventory and Days on Market

-- Unsold inventory increased in January 2023, compared to a year ago in January 2022, by 88 percent or higher in all price ranges, with the $500,000-$749,000 price range gaining the most (112.5 percent), followed by the $1 million-and-up price tier (105.0 percent), the $750,000-$999,000 (100.0 percent) and the sub-$500,000 (88.9 percent).

-- Weak housing demand continued to create carryover and elevate inventory on the surface, as 48 of the 51 counties tracked by C.A.R. registered an increase in active listings in January 2023 compared to January 2022.

-- The median number of days it took to sell a California single-family home was 33 days in January 2023, compared to 28 days in December 2022 and 12 days in January 2022. Other statewide inventory figures for 2022 include 28 days in December, 24 days in November, 23 days in October 2022, 22 days in September 2022 and 19 days in August 2022.

-- In San Diego, the median number of days it took to sell an existing, single-family home was 26 days in January 2023, compared to 20 days in December 2022 and nine days a year ago in January 2022. Other inventory figures for 2022 in San Diego was 18 days in both November and October, 19 days in September, 15 days in August, 10 days in July, eight days in June and seven days in May and April. The median represents a time when half the homes sell above it and half below it.

-- Once again, the statewide, sales-price-to-list-price ratio remained at below 100 percent in January 2023 at 96.5 percent. A year ago, in January 2020, the ratio was 101.2 percent. Other 2022 statewide ratio percentage figures include 96.2 percent in December, 96.7 percent in November, 97.3 percent in October, 97.7 percent in September and 98.4 percent in August. The sales-to-list-price ratio is an indicator that reflects the negotiation power of home buyers and home sellers under current market conditions. The ratio is calculated by dividing the final sales price of a property by its last list price and is expressed as a percentage. A sales-to-list ratio with 100 percent or above suggests that the property sold for more than the list price, and a ratio below 100 percent indicates that the price sold below the asking price.

-- The 30-year, fixed-mortgage interest rate averaged 6.27 percent in January 2023, up from 3.45 percent in January 2022, according to Freddie Mac.


Topics: Brokers/Managers, Market Information

Comment now! Point of Sale Mandate Included in County Recommendations

Posted by PSAR Government Affairs on Jan 31, 2023 9:24:12 AM

No on Point of Sale


San Diego County staff recommends home energy audits during the home sales process.

This strategy is part of a  "Draft Playbook"  released by County staff.  The Playbook is described as a "menu of actions" that is intended as a resource for local governments who seek to take action on decarbonization.

PSAR opposes point-of-sale mandates.  Point of Sale mandates hurt buyers and sellers. They make homes more expensive to buy and since they target such a small number of homes, they do very little to address carbon reduction.

The County is accepting feedback on the Draft Playbook until Thursday, February 2.  Please leave a comment now explaining why point-of-sale or "time-of-sale" mandates are a bad idea.  It is most important to demonstrate how these mandates will impact your clients. 

To add a comment, click on the box below to open the County document, scroll to the section of the document you would like to comment on, and click the section.  A popup window will appear to allow you to leave a comment. 

You will find that point-o-sale mandates are described in the "Requirement" section of items 4.4.1 and item 5.5.1. Time-of-sale is also referred to in section 5.5.4.2.  Click on each of those sections and leave a comment.

For a list of reasons why point-of-sale mandates are a bad idea, you are welcome to refer to the letter from PSAR President Jason Lopez to the County, CLICK HERE to see the letter. You are encouraged to share those ideas in your comments. 

For questions or concerns, please email gad@psar.org

Click Here to Comment


Topics: Brokers/Managers, Government Affairs

Interest Rate Reprieve Bolsters December Home Sales

Posted by Rick Griffin on Jan 24, 2023 10:39:30 AM

RISING INTEREST RATES DEPRESS HOME SALES, PRICES

A short respite in rising interest rates helped edge up California home sales in December 2022 to break a three-month sales decline. However, for the year as a whole, statewide home sales were down 23.1 percent from 2021.

According to the latest home sales and price report from the California Association of REALTORS® (C.A.R), closed escrow sales of existing, single-family detached homes in California totaled a seasonally adjusted annualized rate of 240,330 in December, according to information collected by C.A.R. from more than 90 local REALTOR® associations and MLSs statewide. The statewide annualized sales figure represents what would be the total number of homes sold during 2022 if sales maintained the December pace throughout the year. It is adjusted to account for seasonal factors that typically influence home sales.

The December 2022 statewide sales pace for existing, single-family homes was up 1.1 percent on a monthly basis from 237,740 in November 2022 and down 44.1 percent from a year ago in December 2021, when 429,860 homes were sold on an annualized basis.

December 2022 was the second straight month for home sales below the 250,000-unit level statewide.

Meanwhile, California’s median home price remained on a downward trend for the fourth straight month. It has been down on a monthly basis for the past six of seven months.

The December 2022 statewide median home price of $774,580 was down 0.4 percent from the $777,500 recorded in November 2022. The December 2022 price also was lower on a year-over-year basis for the second consecutive month, declining 2.8 percent from the $796,570 recorded last December 2021. 

For 2022 as a whole, California’s median home price increased 4.5 percent from 2021’s $786,750 figure but is expected to decline by 8.8 percent in 2023.

In San Diego, home sales increased month-over-month by 0.8 percent in December 2022, compared to November 2022. However, in a year-over-year comparison, between December 2022 and December 2021, home sales decreased by 43.2 percent from the same month a year ago.

December 2022 County Sales and Price Activity
(Regional and condo sales data not seasonally adjusted)

December 2022 County Sales and Price Activity

In San Diego, the median sales price for an existing, single-family detached home in San Diego County declined in December 2022 by 1.7 percent or $15,000 to $850,000, compared to $865,000 in November 2022. However, in a year-over-year comparison, between December 2022 and December 2021, the median home price increased by 1.6 percent from $836,700 from the same month a year ago.

“It’s encouraging to see an uptick in December’s home sales as buyers took advantage of a slightly more favorable lending environment that provided them with a window of opportunity to enter the California housing market,” said C.A.R. President Jennifer Branchini, a Bay Area REALTOR®. “As buyers and sellers gradually adapt to the new normal, we are seeing a shift toward a more balanced market. With both sides slowly adjusting their expectations, it’s hopeful that we’ll see sales ratcheting higher as market conditions improve further throughout 2023.”

“Home prices are holding up relatively well, despite rising interest rates and falling housing demand in recent months. Tight housing inventory was a primary factor preventing prices from free falling as new active listings continued to dip to reach the lowest level in at least the past five years,” said C.A.R. Vice President and Chief Economist Jordan Levine. “While depressed inventory will preclude major price declines beyond the 8.8 percent we forecast for this year, it will also slow sales growth and prevent the housing market from having a rapid recovery.”

Other key points from C.A.R.’s December 2022 resale housing report include:

 -- At the regional level, all major regions recorded year-over-year sales drops of more than 35 percent, with Southern California incurring the biggest decline of all regions for the third month in a row at minus 48.3 percent.

-- At the regional level, median home prices dropped from a year ago in all major regions, with the San Francisco Bay Area experiencing the biggest annual price decline at 9.6 percent. The median home price drop in the Southern California region for the month was 0.9 percent.

December 2022 County Unsold Inventory and Days on Market
(Regional and condo sales data not seasonally adjusted)

December 2022 County Unsold Inventory and Days on Market

-- Housing inventory in California continued to rise on a month-over-month comparison in 2022, compared to 2021, except as the year came to an end. The statewide unsold inventory index in December 2022 was 2.7 months, which was more than double the 1.2 months recorded in December 2021 but was down from the 3.3 months registered in November 2022.

-- In San Diego, the inventory of available homes for sale in December 2022 declined to 2.2 months, compared to 2.9 months in November 2022. A year ago, in December 2021, the figure was one month. Other inventory figures in San Diego in 2022 include 3.0 months in October, 2.7 months in September, 2.5 months in August, 3.1 months in July, 2.4 months in June, 1.9 months in May, 1.6 months in April and 1.4 months in March. Inventory levels indicate the number of months it would take for the available supply of homes on the market to sell-out given the current rate of sales.

-- Unsold inventory in all home price ranges on a statewide basis increased in December 2022, compared to December 2021, by 92 percent or more. For example, in the final month of the year, the unsold inventory in the $1 million and higher price range gained the most (154.5 percent), followed by the $750,000-$999,000 price range (145.5 percent), the $500,000-$749,000 (136.4 percent) and the sub-$500,000 segment (92.9 percent).

-- The median number of days it took to sell a California single-family home was 28 days in December 2022, 24 days in November 2022 and 12 days in December 2021. Other statewide inventory figures for 2022 include 23 days in October 2022, 22 days in September 2022 and 19 days in August 2022.

-- In San Diego, the median number of days it took to sell an existing, single-family home was 20 days in December 2022, compared to 18 days in both November 2022 and October 2022 and eight days in December 2021. Other San Diego days-on-market figures for 2022 include 19 days in September, 15 days in August, 10 days in July, eight days in June and seven days in May and April. The median represents a time when half the homes sell above it and half below it.

-- Once again, the statewide, sales-price-to-list-price ratio remained at below 100 percent in December 2022 at 96.2 percent. A year ago in December 2021, the ratio was 101.2 percent. Other 2022 statewide ratio figures include 96.7 in November, 97.3 percent in October, 97.7 percent in September and 98.4 percent in August. The sales-to-list-price ratio is an indicator that reflects the negotiation power of home buyers and home sellers under current market conditions. The ratio is calculated by dividing the final sales price of a property by its last list price and is expressed as a percentage. A sales-to-list ratio with 100 percent or above suggests that the property sold for more than the list price, and a ratio below 100 percent indicates that the price sold below the asking price.

-- The 30-year, fixed-mortgage interest rate averaged 6.36 percent in December, up from 3.10 percent in December 2021, according to Freddie Mac.

Topics: Brokers/Managers, Market Information

San Diego Home Days on Market for November was 18 Days

Posted by Rick Griffin on Dec 21, 2022 1:46:05 PM

RISING INTEREST RATES DEPRESS HOME SALES, PRICES

Housing demand continued to fall as rising interest rates dampened the California housing market in November 2022.

In November 2022, home sales were at their lowest annualized pace since October 2007 and the largest year-over-year sales drop in the past four decades, according to the latest home sales and price report from the California Association of REALTORS® (C.A.R).

Overall, home sales have been on a downward trend for 17 straight months on a year-over-year basis. November 2022 was the fourth time in the last five months that sales dropped more than 30 percent from the year-ago level.

November 2022’s monthly 13.2 percent sales decline was worse than the long-run average of -0.5 percent change recorded between October and November in the past 43 years.

Sales in all price segments dropped more than 40 percent year-over-year, with the $2 million plus price segment falling the most at 47.7 percent. The most affordable market (sub-$300,000) experienced the smallest sales drop at 41.4 percent.

Closed escrow sales of existing, single-family detached homes in California totaled a seasonally adjusted annualized rate of 237,740 in November, according to information collected by C.A.R. from more than 90 local REALTOR® associations and MLSs statewide. The statewide annualized sales figure represents what would be the total number of homes sold during 2022 if sales maintained the November pace throughout the year. It is adjusted to account for seasonal factors that typically influence home sales.

November’s sales pace was down 13.2 percent on a monthly basis from 274,040 in October and down 47.7 percent from a year ago when 454,450 homes were sold on an annualized basis. The year-to-year sales decline was the biggest since 1980.

Year-to-date statewide home sales were down 21.2 percent in November 2022.

In San Diego, home sales dropped 44.1 percent in November 2022, compared to a year ago in November 2021, and 11.4 percent lower in a month-over-month comparison with October 2022.

Meanwhile, California’s median home price declined for the third straight month in November 2022, dropping 3.0 percent to $777,500 from the $801,190 recorded in October 2022. November 2022’s price was 0.6 percent lower than the $782,480 recorded a year ago in November 2021. November 2022 also marked the first year-over-year price decline in 30 months. The November 2022 price was also the lowest since February 2022.

November 2022 County Sales and Price Activity
(Regional and condo sales data not seasonally adjusted)

November 2022 County Sales and Price Activity

In San Diego, the median sales price for an existing, single-family detached home in San Diego County rose 0.6 percent to $865,000 in November 2022, compared to $860,000 in October 2022. The November 2022 median price was 2 percent higher than the year-ago price of $847,750 in November 2021. The median is the price at which half of the homes sell for more and half for less.

“While interest rates are higher than year-ago levels, they have been declining since early November from the recent peak of over 7 percent,” said C.A.R. President Jennifer Branchini, a Bay Area REALTOR®. “With home prices cooling and market competition easing in recent months, some qualified buyers who missed out on the hurried market of the last two years are taking advantage of the shift and finding sellers more willing to negotiate than they have been up to this point.”

“As expected, higher borrowing costs, lower demand, and rising uncertainty finally caused prices to moderate for the first time in more than a decade while home sales dropped further,” said C.A.R. Vice President and Chief Economist Jordan Levine. “With mortgage rates rising at the fastest pace in years, sales and price growth will likely remain on a downward trend in the short term. However, pending sales suggest that the pace of declines should moderate in the coming months.”

Other key points from C.A.R.’s November 2022 resale housing report include:

 -- At the regional level, Southern California saw the biggest year-over-year sales drop again as all six counties within the region marked sales declines of more than 44 percent in November 2022.

-- Sharp declines in housing demand continued to apply downward pressure on home prices as median prices in three of the five major regions dropped mildly from a year ago. Southern California’s (0.0 percent) median prices were virtually unchanged or flat on a year-over-year basis, despite having the largest sales drops among all regions in November 2022.

-- More counties began to experience negative price growth in November 2022 as 33 counties registered median prices decline, a jump from 22 counties compared to the prior month.

November 2022 County Unsold Inventory and Days on Market
(Regional and condo sales data not seasonally adjusted)

November 2022 County Unsold Inventory and Days on Market

-- Housing inventory in November 2022 in California continued to rise both month-to-month and year-to-year as the market entered its holiday season and home sellers remained on the sideline. The statewide unsold inventory index was 3.3 months in November 2022 and 3.2 months in October 2022. The November 2022 index was more than double the level of 1.6 months in November 2021.

-- Housing supply in California increased in November 2022 in all price ranges by 88 percent compared to a year ago in November 2021. Unsold inventory in the $1 million+ price range rose the most (128.6 percent), followed by the $500,000-$749,000 price range (113.3 percent), the $750,000- $999,000 (113.3 percent) and the sub-$500,000 (88.9 percent) ranges.

-- In San Diego, the inventory of available homes for sale in November 2022 declined to 2.9 months, compared to 3.0 months in October 2022 and 1.3 months a year ago in November 2021. Other inventory figures in 2022 include 2.7 months in September, 2.5 months in August, 3.1 months in July, 2.4 months in June, 1.9 months in May, 1.6 months in April and 1.4 months in March. Inventory levels indicate the number of months it would take for the available supply of homes on the market to sell-out given the current rate of sales.

-- The median number of days it took to sell a California single-family home was 24 days in November 2022, compared to 23 days in October 2022, 22 days in September 2022, 19 days in August 2022 and 11 November 2021.

-- In San Diego, the median number of days it took to sell an existing, single-family home was 18 days in both November 2022 and October 2022, compared to 19 days in September 2022 and nine days in November 2021. Other days-on-market figures in 2022 include 15 days in August, 10 days in July, eight days in June and seven days in May and April. The median represents a time when half the homes sell above it and half below it.

 -- Once again, the statewide, sales-price-to-list-price ratio remained at below 100 percent. It was 96.7 in November 2022, compared to 97.3 percent in October 2022, 97.7 percent in September 2022 and 98.4 percent in August 2022. A year ago in 2021, it was 104 percent in November, 101.5 percent in October, 101.9 percent in September and 102.8 percent in August. The sales-to-list-price ratio is an indicator that reflects the negotiation power of home buyers and home sellers under current market conditions. The ratio is calculated by dividing the final sales price of a property by its last list price and is expressed as a percentage. A sales-to-list ratio with 100 percent or above suggests that the property sold for more than the list price, and a ratio below 100 percent indicates that the price sold below the asking price.

-- The 30-year, fixed-mortgage interest rate averaged 6.81 percent in November 2022, up from 3.07 percent in November 2021, according to Freddie Mac. The five-year, adjustable mortgage interest rate averaged 6.01 percent, compared to 2.51 percent in November 2021.

Topics: Brokers/Managers, Market Information

SAN DIEGO HOME PRICES DROP TO $860K IN OCT., $899K IN SEPT.

Posted by Rick Griffin on Nov 18, 2022 5:20:00 PM

RISING INTEREST RATES DEPRESS HOME SALES, PRICES

Higher interest rates led to further decline in the California housing market in October 2022 as home sales hit their lowest level since February 2008 with the largest year-over-year decline since December 2007, outside the pandemic.

According to the latest home sales and price report from the California Association of REALTORS® (C.A.R.), year-to-date statewide home sales were down 18.5 percent in October 2022.

Also in October 2022, sales were down 10.4 percent on a monthly basis from 305,680 units sold in September 2022 and down 36.9 percent from a year ago in October 2021, when 434,170 homes were sold on an annualized basis.

Overall, statewide home sales have been on a downward trend for 16 straight months on a year-over-year basis. October 2022 was the third time in the last four months that sales dropped more than 30 percent from a year-ago level.

The monthly 10.4 percent sales decline in October 2022 was worse than the long-run average of +0.5 percent change recorded between September and October in the past 43 years.

Sales in all price segments continued to drop by 30 percent or more year-over-year, with the $750,000-$999,000 price segment declining the most at 40.8 percent. The high-end market ($1 million-$1,999,000) experienced the smallest sales drop at 34.1 percent.

Closed escrow sales of existing, single-family detached homes in California totaled a seasonally adjusted annualized rate of 274,040 in October, according to information collected by C.A.R. from more than 90 local REALTOR® associations and MLSs statewide. The statewide annualized sales figure represents what would be the total number of homes sold during 2022 if sales maintained the October pace throughout the year. It is adjusted to account for seasonal factors that typically influence home sales.

In San Diego County, home sales dropped 40.7 percent in October 2022,  compared to a year ago in October 2021, and 15.6 percent lower in a month-over-month comparison with September 2022.

San Diego’s October 2022 year-over-year drop of 40.7 percent compares to September 2022’s year-over-year drop of 33.2 percent.

Home prices also continued declining statewide and locally.

California’s median home price declined 2.5 percent in October 2022 to $801,190 from the $821,680 price recorded in September 2022. The October 2022 price was a mere 0.3 percent higher than the $798,440 price recorded a year ago in October 2021 and was the smallest year-over-year price gain in 29 months. October 2022 marked the fifth consecutive month with a single-digit annual price increase.

With the average 30-year fixed mortgage rate expected to remain above 6.5 percent for the rest of the year, home prices are expected to moderate even further in the coming months as affordability will remain challenging.

October 2022 County Sales and Price Activity
(Regional and condo sales data not seasonally adjusted)

October 2022 County Sales and Price Activity

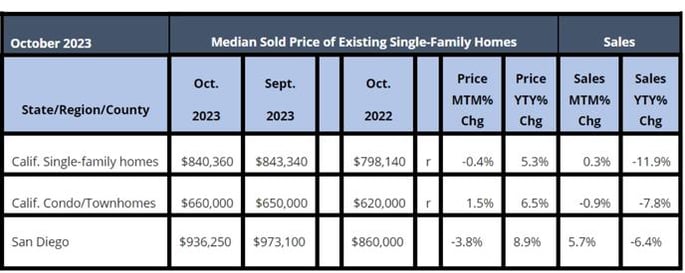
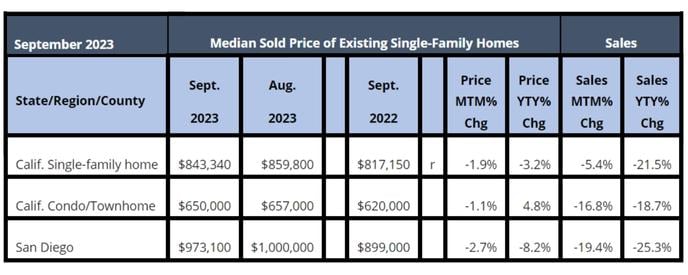
In San Diego, the median sales price for an existing, single-family detached home in San Diego County declined 4.3 percent to $860,000 in October 2022, compared to $899,000 in September 2022. The October 2022 median price was 1.2 percent higher than the year-ago price of $850,000 in October 2021. The median is the price at which half of the homes sell for more and half for less.

“While October’s sales and price results were weaker than what we’ve experienced in the past couple of years and could slow further in the upcoming off-season, the market bottom could be in sight,” said 2023 C.A.R. President Jennifer Branchini, a Bay Area REALTOR®. “Homes are still selling relatively quickly at 23 days on the market, one in four homes is selling above list price due to limited inventory, and with median price growth remaining positive in four of the five price segments, home prices are holding up reasonably well.”

“Excluding the three-month pandemic lockdown period in spring 2020, October’s sales level was the lowest since February 2008. With pending sales showing a 50 percent drop from a year ago, we can expect additional tempering in housing demand in the coming months, as we previously forecasted,” said C.A.R. Vice President and Chief Economist Jordan Levine. “Home prices will also moderate further over the next several months as interest rates remain elevated in the near term and seasonal factors come into play.”

Other key points from C.A.R.’s October 2022 resale housing report include:

-- At the regional level, home sales continued to fall sharply from last year, with four of the five major regions falling more than 35 percent from last year. Southern California had the biggest annual drop in sales at 40.8 percent, as every county within the region experienced a sales decline of more than 30 percent in October.

-- At the county level, all but one California county recorded a year-over-year home sales decline in October, with 41 of them plunging more than 20 percent from the same period a year ago.

-- At the county level for home prices, more than half of all counties in California maintained positive year-over-year median-price growth in October 2022. Prices were up from last year by double-digits in eight counties in October 2022 compared to five counties in the prior month.

October 2022 County Unsold Inventory and Days on Market
(Regional and condo sales data not seasonally adjusted)

October 2022 County Unsold Inventory and Days on Market

-- Housing inventory in October 2022 in California rose on a month-to-month basis and year-to-year basis at the beginning of the fourth quarter. Many potential buyers continued to put their home-buying plans on hold. The statewide unsold inventory index increased to 3.3 months in October 2022 from 2.9 months recorded in September 2022 and from 1.8 months recorded a year ago in October 2021.

-- Housing supply in California increased in October 2022 in all price ranges by 75 percent or more overall from a year ago in October 2021. Inventory improved the most (88.2 percent) for homes priced from $500,000 to $749,000. Other inventory increases in percentages included 83.3 percent for homes priced from $750,000 to $999,000, 82.4 percent in the $1 million and up price range, and 75 percent in the sub-$500,000 price range.

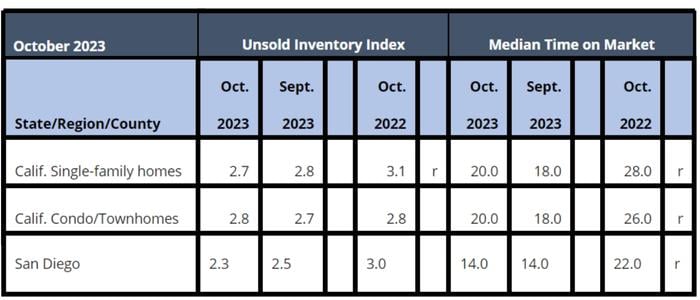
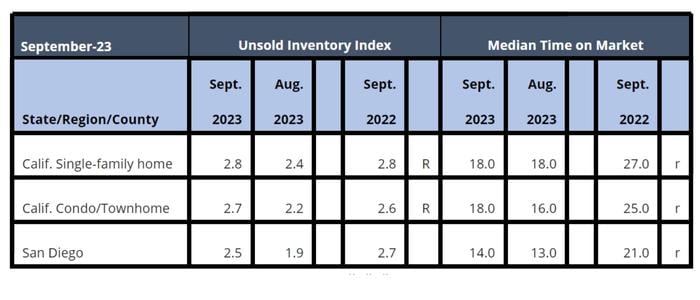
-- In San Diego, the inventory of available homes for sale in October 2022 increased to 3.0 months, compared to 2.7 months in September 2022, and 1.5 months a year ago in October 2021. Other inventory figures in 2022 include 2.5 months in August, 3.1 months in July, 2.4 months in June, 1.9 months in May, 1.6 months in April and 1.4 months in March. Inventory levels indicate the number of months it would take for the available supply of homes on the market to sell-out given the current rate of sales.

-- The median number of days it took to sell a California single-family home was 23 days in October 2022, compared to 22 days in September 2022, 19 days in August 2022 and 11 days in October 2021.

-- In San Diego, the median number of days it took to sell an existing, single-family home was 18 days in October 2022, compared to 19 days in September 2022 and nine days in October 2021. Other days-on-market figures in 2022 include 15 days in August, 10 days in July, eight days in June and seven days in May and April. The median represents a time when half the homes sell above it and half below it.

-- Once again, the statewide, sales-price-to-list-price ratio remained at below 100 percent. It was 97.3 percent in October 2022, compared to 97.7 percent in September 2022 and 98.4 percent in August 2022. A year ago in 2021, it was 101.5 percent in October, 101.9 percent in September and 102.8 percent in August. The sales-to-list-price ratio is an indicator that reflects the negotiation power of home buyers and home sellers under current market conditions. The ratio is calculated by dividing the final sales price of a property by its last list price and is expressed as a percentage. A sales-to-list ratio with 100 percent or above suggests that the property sold for more than the list price, and a ratio below 100 percent indicates that the price sold below the asking price.

-- The 30-year, fixed-mortgage interest rate averaged 6.90 percent in October, up from 3.07 percent in October 2021, according to Freddie Mac. The five-year, adjustable mortgage interest rate averaged 5.71 percent, compared to 2.54 percent in October 2021.

Topics: Brokers/Managers, Market Information