Homebuyers continue to wait it out, says C.A.R.

Posted by Rick Griffin on Nov 21, 2018 9:34:49 AM

Hosing Market graphs California’s housing market declined for the sixth straight month in October, according to the latest housing market report from the California Association of REALTORS® (C.A.R). C.A.R. also found that existing home sales in the state dropped below the 400,000 level for a third consecutive month. The last time there were three straight months when the sales dipped below 400,000 was February 2015.
Summarizing the overall housing market, mortgage rates remain affordable while demand for existing homes is slowing, home prices are falling slightly, price growth is moderating, price reductions are becoming more common and a tight supply of available homes, still low, is increasing, while many potential buyers are putting their homeownership plans on hold.

In October, C.A.R. said the month’s sales figures was up 3.8 percent from the revised 382,550 level in September and down 7.9 percent compared with home sales in October 2017 of 431,070.

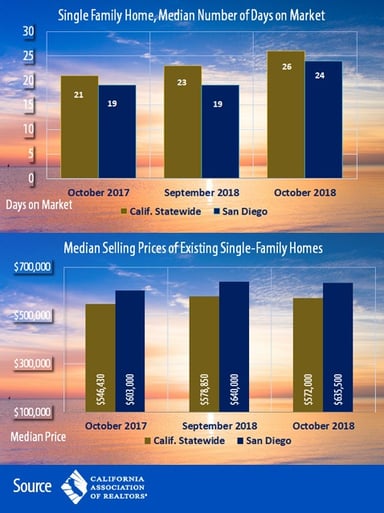
C.A.R. said October’s statewide median home price was $572,000, down 1.2 percent from September ($578,850) and up 4.7 percent from October 2017 ($546,430).

In San Diego County, the median price of a single-family home was $635,500 in October 2018, a slight decrease from the $640,000 price reported for September 2018 and a 13.2 percent decline from October 2017 when the median price was $603,000. San Diego’s year-over-year comparison between October 2018 and October 2017 was the largest decrease among any Southern California market, said C.A.R. Orange, San Bernardino, and San Diego counties all experienced year-over-year, double-digit declines of 11.3 percent, 11.4 percent, and 13.2 percent, respectively. Sales in Los Angeles County declined 5.9 percent and were down 2.9 percent in Riverside County.

Closed escrow sales of existing, single-family detached homes in California totaled a seasonally adjusted annualized rate of 397,060 units in October, according to information collected by C.A.R. from more than 90 local REALTOR® associations and MLSs statewide. The statewide annualized sales figure represents what would be the total number of homes sold during 2018 if sales maintained the October pace throughout the year. It is adjusted to account for seasonal factors that typically influence home sales.

“Homebuyers continued to put their homeownership plans on hold in October and wait out the market,” said 2019 C.A.R. President Jared Martin. “With mortgage rates at seven-year highs making homeownership more expensive and home prices beginning to flatten, this phenomenon will likely continue for the near term as buyers wait for further price adjustments and for interest rates to stabilize.”

“October’s sales decline was not as severe as the double-digit drop experienced in September, but the continued pullback in sales suggests the market will continue to slow and likely soften further into 2019,” said C.A.R. Senior Vice President and Chief Economist Leslie Appleton-Young. “Likewise, as home sales continue to soften, the median price, which was the lowest since March 2018, will also ease up,” said Appleton-Young.

Other key points from C.A.R.’s October 2018 resale housing report included:

  • Homes are taking longer to sell than they did just a few months ago. The median number of days it took to sell a California single-family home rose from 21 days in October 2017 to 26 days in October 2018.
  • Meanwhile, in San Diego County, the median number of days a home remained unsold on the market was 24 days in October 2018, compared to 19 days in both September 2018 and October 2017.
  • Statewide active listings rose for the seventh consecutive month after nearly three straight years of declines, increasing 28 percent from the previous year. October’s listings increase was the largest in four years.
  • Active listings in the $500,000-$750,000 price range experienced the largest year-over-year gain (43.9 percent), followed by homes priced $750,000-$999,999 (40.1 percent). The sub-$200,000 market was the only price segment with a decline of 6.2 percent from last year.

    The unsold inventory index, which is a ratio of inventory over sales, increased year-to-year for the seventh consecutive month in October from 3.0 months in October 2017 to 3.6 months in October 2018. The index measures the number of months it would take to sell the supply of homes on the market at the current sales rate.
  • The 30-year, fixed-mortgage interest rate averaged 4.83 percent in October, up from 3.90 percent in October 2017, according to Freddie Mac. The five-year, adjustable mortgage interest rate also increased in October to an average of 4.08 percent from 3.18 from October 2017.
In other recent real estate and economic news, according to news reports:
  • According to real estate tracker CoreLogic, a chill is settling over the once white-hot Southern California housing market. San Diego home sales decreased 17.5 percent in September 2018. A total of 2,942 homes were sold in the county, down 17.5 percent from 3,568 during the same month the previous year. It was the lowest number of sales for a September in 11 years, compared to September 2007 just before the Great Recession when 2,152 units were sold.
  • CoreLogic also said in September 2018, the median price of a San Diego County home was $575,000, up 7.5 percent from $535,000 in September 2017, but it was the first decrease since January 2018 after hitting an all-time high of $583,000 in August. Most experts are attributing the slowdown to a rise in mortgage interest rates as potential buyers balk at higher monthly payments.
  • The number of seriously underwater homes in San Diego County continued to decline in the third quarter as home equity maintained an upward trajectory, according to Attom Data Solutions. The real estate analytics company’s latest report found that only 6.5 percent of San Diego homes surveyed had mortgages that were at least 25 percent higher than the property's estimated market value.
  • Discounts, gift cards, and free streaming services for new renters are on the rise across the nation, but San Diego County seems to be bucking that trend, according to a HotPads report. The online real estate company found that rental listings advertising a concession have increased by 15.8 percent since the fall of last year, but San Diego County has seen a 27.1 percent decrease in rental concessions year-over year. HotPads pegged the median San Diego County rent at $2,680 a month, representing a 4.8 percent year-over-year increase.
  • San Diego County’s unemployment rate rose slightly in October, although total nonfarm employment increased by more than 10,000 jobs, according to the California Employment Development Dept. The county unemployment rate ticked up from an adjusted 3.2 percent in September to 3.3 percent in October, but is down from 3.6 percent in October 2017. A year ago, the rate stood at 3.6 percent.
  • Wages and salaries jumped by 3.1 percent in October, the highest level in a decade. Also in October, U.S. consumer confidence rose to an 18-year high amid optimism about jobs and the economy, according to the Conference Board.

Topics: Market Information, Industry

Housing Market is Cooling, Inventory Rising, Buyers are Waiting

Posted by Rick Griffin on Oct 26, 2018 4:32:22 PM

HOUSING MARKET IS COOLING

California’s housing market “continued to deteriorate” in September, according to the latest housing market report from the California Association of REALTORS® (C.A.R). Mortgage rates remain affordable while demand for existing homes is slowing, home prices are rising at a slower rate and a tight supply of available homes, still low, is increasing.

In September, C.A.R. said the state’s housing market posted its largest year-over-year sales decline since March 2014. In addition, home sales remained below the 400,000-level sales benchmark for the second consecutive month, indicating that the market is slowing as many potential buyers put their homeownership plans on hold.

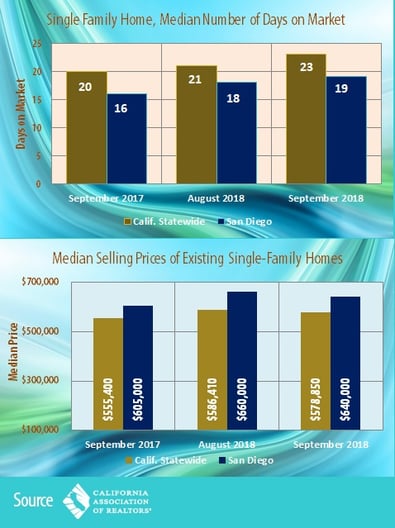
C.A.R. said September’s statewide median home price dropped to $578,850 in September. The September 2018 statewide median price was down 2.9 percent from $596,410 in August 2018 but up 4.2 percent from a revised $555,400 in September 2017.

In San Diego County, the median price of a single-family home in San Diego County was $640,000 in September 2018, up from $605,000 during the same month a year ago, according to CAR. The median price in September 2018 was down 3 percent from $660,000 in August 2018.

Closed escrow sales of existing, single-family detached homes in California totaled a seasonally adjusted annualized rate of 382,550 units in September, according to information collected by C.A.R. from more than 90 local REALTOR® associations and MLSs statewide. The statewide annualized sales figure represents what would be the total number of homes sold during 2018 if sales maintained the September pace throughout the year. It is adjusted to account for seasonal factors that typically influence home sales.

“The housing market continued to deteriorate and the decline in sales worsened as interest rates remained on an upward trend,” said C.A.R. President Steve White. “More would-be buyers are self-sidelining as they believe home prices will start to come down soon, making housing more affordable despite rising interest rates. Tax reform, which increases the cost of homeownership, also is contributing to the decline, especially in high-cost areas such as the San Francisco Bay Area and Orange County.”
“Price appreciations have slowed in the last few months and inventory has risen considerably since June when the statewide median price hit a new peak,” said C.A.R. Senior Vice President and Chief Economist Leslie Appleton-Young. “Buyers are becoming increasingly concerned about market developments and are reluctant to purchase at the prevailing market price. As such, the deceleration in price growth will likely continue in coming months.”

Other key points from C.A.R.’s September 2018 resale housing report included:

  • -- Homes are taking longer to sell than they did just a few months ago. The median number of days it took to sell a California single-family home ticked up from 20 days in September 2017 to 23 days in September 2018, a sign that market competitiveness is not as heated as it was in 2017. The statewide number of days for August 2018 was 21 days. Meanwhile, in San Diego County, the median number of days a home remained unsold on the market was 19 days in September 2018, compared to 18 days in August 2018 and 16 days in September 2017.
  • -- Statewide active listings rose for the sixth consecutive month following 33 straight months of declines, increasing 20.4 percent from the previous year. September’s listings increase was the biggest in nearly four years.
  • -- The Unsold Inventory Index, which is a ratio of inventory over sales, rose again to 4.2 months in September 2018 from 3.3 months in September 2017. It was the highest level in 31 months. The index measures the number of months it would take to sell the supply of homes on the market at the current sales rate.
  • -- The 30-year, fixed-mortgage interest rates averaged 4.63 percent in September, up from 3.81 percent in September 2017, according to Freddie Mac. The five-year, adjustable mortgage interest rate also increased in September to an average of 3.94 percent from 3.16 percent from September 2017.
In other recent real estate and economic news, according to news reports:
  • U.S. home sales fell for the sixth straight month in September 2018, a sign that housing is remaining a weak spot for the economy. The National Association of REALTORS® said that sales declined 3.4 percent in September, the biggest drop in 2 ½ years, to a seasonally adjusted annual rate of 5.15 million. That’s the lowest sales pace since November 2015.
  • Rising mortgage rates, paired with already high home prices, are giving pause to homebuyers and are partly to blame for the slowdown in sales, according to CoreLogic. With some rates running at around 5 percent for 30-year fixed-rate loans, CoreLogic reported that mortgage rates this summer reached the highest level in seven years, making it harder for some buyers to enter the market.
  • Mortgage payments are rising faster than home values. A new Zillow analysis report found that monthly mortgage payments are rising at significantly higher levels than home values. For example, in San Diego County, the median home value rose just 4.9 percent year-over-year while the monthly mortgage payments jumped by 13.6 percent from a year ago, according to Zillow.
  • According to Redfin, San Diego County’s housing inventory level climbed 30.7 percent year-over-year in September, trailing only San Jose (82.7 percent) and Seattle (54.5 percent). Inventory levels may have climbed, but Redfin’s recent overall assessment for San Diego County still gives us an 84 out of 100 ranking on a competitive scale with 100 being the most competitive.
  • Rents have stabilized recently, which means many would-be buyers may not feel as much pressure to buy a home right now. However, looking ahead, San Diego County's average rent is projected to soar to $2,187 by 2020, according to a forecast by the USC Lusk Center for Real Estate in partnership with Beacon Economics. The USC forecast estimates that in two years average monthly rents in San Diego County will increase by $209 over their current levels. It also predicts rents will rise by $91 in Los Angeles County, by $52 in Orange County, by $107 in Ventura County and by $78 in the Inland Empire. The forecast also said while San Diego County's vacancy rate was unchanged at 3.94 percent in 2018, it is projected to drop to 3.75 percent in 2020 despite several thousand units that are either under construction or will be in development soon.
  • Analysts remain mostly optimistic about the broader economy. Most forecast growth will top 3 percent for an annual rate in the July-September quarter, after a robust expansion of 4.2 percent in the second quarter.
  • San Diego County created 700 jobs in September 2018 and added 27,000 jobs in the past year, according to a recent jobs report from the California Economic Development Department. The largest month-over-month increases occurred in the government sector, which added 5,100 jobs. With the creation of 14,700 jobs, the professional and business services sector reported the largest year-over gains. San Diego County's unemployment rate fell from a revised 3.4 percent in August to 3.2 percent in September. By comparison, the unadjusted unemployment rate was 3.9 percent for California and 3.6 percent for the nation during the same time frame, according to the report.

Topics: Market Information

East County Housing Market Overview

Posted by Rick Griffin on Oct 5, 2018 5:16:21 PM

East County housing market

Here is the latest in the real estate market in the San Diego’s East County region in the following zip codes: 91901, 91905, 91906, 91916, 91917, 91931, 91934, 91935, 91941, 91942, 91945, 91948, 91962, 91963, 91977, 91978, 91980, 92004, 92019, 92020, 92021, 92036, 92040, 92066, 92070, 92086. The following statistics on housing market activity in the East County is from the HomeDex Housing Market Report for August 2018.

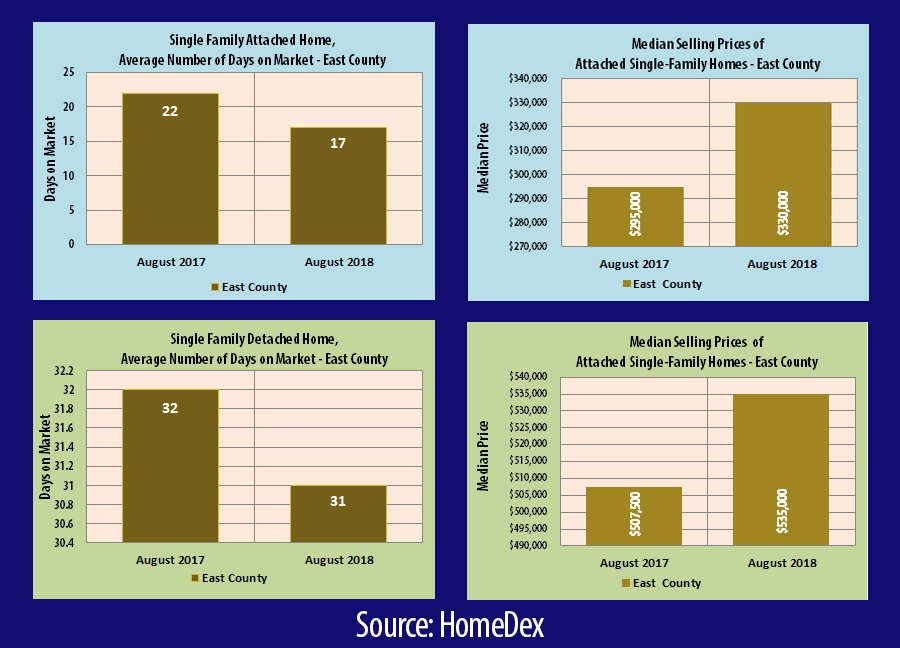
  • The median sales price for a detached single-family home in East County reached $535,000 in August 2018, which was 5.4 percent higher than the $507,500 price in August 2017. The August 2018 monthly figure for detached homes is higher than the year-to-date median sales price of $522,000.
  •  For attached homes, the median home price in the East County was $330,000 in August 2018, which was 11.9 percent higher compared to the $295,000 price the same month a year ago. The August 2018 monthly figure for attached homes is higher than the year-to-date median sales price of $320,000.
  • The average number of days in August for an East County home on the market (the time between when a property is listed and an offer is accepted) was 31 days for detached homes and 17 days for attached homes. In August 2017, the numbers were 32 and 22 days, respectively.
  • Closed sales totaled 304 detached units in August 2018, which was a 24.9 percent year-over-year drop compared to the 405 units sold in August 2017. For attached home sales, closed sales totaled 103 in August, a 12 percent decline from August 2017’s total of 117. 
  • The percentage of original list price received for detached homes was 98.4 percent in August, a 0.3 percent change from 98.7 percent in August 2017. For attached homes, the percentage was 99.3 percent in August, a 0.4 percent difference from 99.7 percent in August 2017.
  • The number of new detached listings on the market in August totaled 672, a 21.7 percent increase from the 552 new listings in August 2017. For new attached listings, the total was 143 in August, a 9.2 percent increase from the 131 new listings in August 2017.
  • The year-to-date totals for detached listings was 6,285 through August, a 7.4 percent increase from 5,854 listings through August 2017; the year-to-date total for attached property listings was 1,663 through August, a 17.2 percent increase from the 1,491 listings through August 2017.
    According to HomeDex, the economy is under scrutiny, but certainly not deteriorating. While some housing experts are starting to look for recessionary signs such as fewer sales, dropping prices and even foreclosures, others are taking a more cautious and research-based approach to their predictions. Housing starts are performing admirably, prices are still inching upward, supply remains low and consumers are optimistic. A report from the National Association of Home Builders (NAHB) said that rising home prices, higher interest rates and increased building material costs have pressured housing affordability to a 10-year low. Nationally, median household income has risen 2.6 percent in the last 12 months, while home prices are up 6 percent.

Topics: Market Information

California Home Sales Falter for 4th Straight Month

Posted by Rick Griffin on Sep 29, 2018 10:11:32 AM

CALIFORNIA HOME SALES FALTER

California’s housing market faltered in August for the fourth straight month as high home prices continue to take a toll on demand statewide, according to the latest report from the California Association of REALTORS® (C.A.R.).

Home sales in San Diego County declined by 10.4 percent in August in a year-over-year comparison. Regionally, Southern California had the largest decline, with sales falling 8 percent in year-over-year. Orange and Los Angeles counties saw year-over-year declines of 10.4 percent and 8.9 percent, respectively.

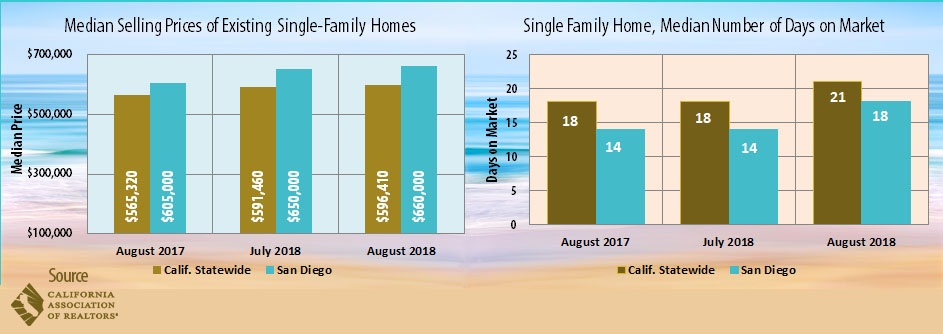
In its August home sales and price report, C.A.R. said the statewide median home price edged higher $596,410, up 0.8 percent from $591,460 July 2018 and up 5.5 percent from a revised $565,320 in August 2017.

In San Diego County, C.A.R. reported that the median single-family housing price was $660,000 in August 2018, compared to $650,000 in July 2018. The August 2018 figure was 9.1 percent higher from the $605,000 registered in August 2017.

Closed escrow sales of existing, single-family detached homes in California totaled a seasonally adjusted annualized rate of 399,600 units in August, according to information collected by C.A.R. from more than 90 local REALTOR® associations and multiple leasing services statewide. The statewide annualized sales figure represents what would be the total number of homes sold during 2018 if sales maintained the July pace throughout the year. It is adjusted to account for seasonal factors that typically influence home sales.

It was the first time in two years for single-family detached home sales to fall below the 400,000 sales benchmark. August’s sales figure was down 1.8 percent from the revised 406,920 level in July and down 6.6 percent compared with home sales in August 2017 of 427,630.

“Home sales activity remained on a downward trend for the fourth straight month as uncertainty about the housing market continues to mount,” said C.A.R. President Steve White. “Buyers are being cautious and reluctant to make a commitment as they are concerned that home prices may have peaked and instead are waiting until there’s more clarity in the market.”

“While home prices continued to rise modestly in August, the deceleration in price growth and the surge in housing supply suggest that a market shift is underway,” said C.A.R. Senior Vice President and Chief Economist Leslie Appleton-Young. “We are seeing active listings increasing and more price reductions in the market, and as such, the question remains, ‘How long will it take for the market to close the price expectation gap between buyers and sellers?’”

Other key points from C.A.R.’s August 2018 resale housing report included:

  • The median number of days it took to sell a California single-family home was 21 days in August 2018, compared to 18 days in July 2018 and 18 days in August 2017. Meanwhile, in San Diego County, the median number of days a home remained unsold on the market was 18 days in August 2018, compared to 14 days in both July 2018 and August 2017.
  •  Statewide active listings rose for the fifth consecutive month after 33 straight months of declines, increasing 17.2 percent from the previous year. August’s listings increase was the biggest in nearly four years. Much of the listings increase is attributable to lower-priced properties. The number of homes available for sale and priced below $750,000 grew more than twice as much as homes priced above that price level. With fewer homes being sold, statewide inventory is starting to climb. The unsold inventory index, which is a ratio of inventory over sales, rose again in August from 2.9 months from August 2017 to 3.3 months in August 2018. The index measures the number of months it would take to sell the supply of homes on the market at the current sales rate.
  • California condominium/townhome median price in August 2018 was $474,570, compared to $486,330 in July 2018 and $446,850 in August 2017.
  • The 30-year, fixed-mortgage interest rates averaged 4.55 percent in August, up from 3.88 percent in August 2017, according to Freddie Mac. The five-year, adjustable mortgage interest rate also increased in August to an average of 3.87 percent from 3.15 from August 2017.
In other recent real estate and economic news, according to news reports:
  • San Diego County home prices in July increased 6.2 percent in the past year year, faster than the nationwide average of 5.9 percent, but slower than other California cities, according to the most recent S&P CoreLogic Case-Shiller 20-city index. In July, Las Vegas was the number-one metro area yet again with a 13.7 percent annual increase. It was followed by Seattle at 12.1 percent and San Francisco at 10.8 percent. The monthly change for local home prices from June to July 2018 was 0.0 percent, according to the report.
  • Realtor.com, operated by the National Association of REALTORS®, reports that the coastal cities of San Jose, Seattle and San Diego were the three markets with the biggest inventory jumps over last year, all posting increases of 28 percent or more. As a result, the increased inventory has led to an increase in price discounts. Realtor.com found that Seattle had an 8 percent increase in price discounts, San Jose had a 7 percent rise in price discounts, and the cities of San Diego, Riverside, Indianapolis, Riverside, and Los Angeles all had a 5 percent spike in price discounts from a year ago. Nearly 40 of the 45 largest markets saw an increase in the share of price discounts over last year.
  • LendingTree reports that San Diego is the second most difficult place in the U.S. to get into a home, behind only Los Angeles. San Francisco came in third. San Diego has an average leverage ratio of 3.62, or the ratio of mortgage cost to borrower's income. The region's leverage ratio is based on a median mortgage amount of $442,000, and a median borrower household income of $122,000. The study used Home Mortgage Disclosure Act (HMDA) data, which includes more than 7 million mortgages originated in 2017, to calculate the leverage rate of borrowers in the 50 largest cities in America. The median amount borrowed was divided by the median borrower income for all purchases in the HMDA database for 2017.
  • Foreclosures and delinquency rates have dipped to a 12-year low, according to CoreLogic. Measuring the number of homeowners who were late on their mortgage payments by more than 30 days, the monthly analysis found that only 4.3 percent of mortgages in June were delinquent nationwide, compared to 4.6 percent the year previous and the same 4.3 percent in March. While the downtick may seem small, the number of Americans failing to make payments on their homes has been falling steadily over the past decade. Neither the delinquency rate nor foreclosure rate has been this low since 2006.
  • WalletHub, a company that offers free credit scores and credit reports updated daily, compared 182 U.S. cities based on 65 key metrics, including movie costs, open hours of breweries and fitness centers per capita, and San Diego came in as the tenth most fun city in America. More specifically, San Diego came in at #10 in number of attractions, #9 in parkland acres per capita, #8 in festivals per capita and #1 for fitness centers per capita. Other categories in which the city scored well included: playgrounds per capita (#19), restaurants per capita (#16, dance clubs per capita (#11) and bar accessibility (#30). Overall, San Diego hosts more than 35 million visitors each year, with that number expected to increase by 3.5 percent in 2018, according to the San Diego Tourism Authority.
  • Near record-low unemployment in the San Diego metropolitan region continued in August, with the rate falling to 3.4 percent from 3.5 percent in July. The state Employment Development Department reported there were 1,529,800 employed in San Diego County in July and just 54,300 unemployed. The unemployment rate in San Diego was below the state level of 4.2 percent and the national level of 3.9 percent. Economists say that even with a strong economy, there will be some “frictional unemployment” due to workers changing jobs. The lowest unemployment rate in San Diego in recent years was 2.9 percent in December 1999, while the highest was 10.9 percent — more than one in 10 workers — in March 2010 during the Great Recession.
  • For the first time in at least 20 years, there are now more job openings than there are people looking for work. There are more jobs than people out of work, something the American economy has never experienced before. There are 6.7 million job openings and just 6.4 million available workers to fill them, according to the Bureau of Labor Statistics.

Topics: Market Information